Earnings Kick Off Week
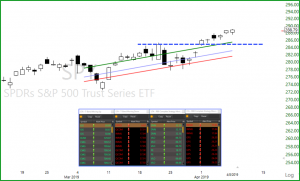
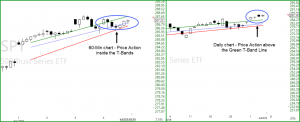
Earnings kick off this week, make sure you double check your dates before buying a stock! The SPY posted another bullish day yesterday. Have you ever noticed how price runs on top of the T-Line and even push higher, then come back to the T-Line and even float below the T-Line for a few days? Yesterday marked the 6th-day price has run above the T-Line. I use the VIX is flexing its muscles this morning, keep a close eye the VIX is a valuable tool when it comes to how deep you’re invested. Above $13.85 on the VIX we will likely lean into a few shorts or puts. The T-2122 chart is on our radar up above 80.
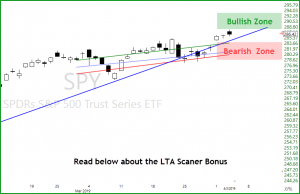
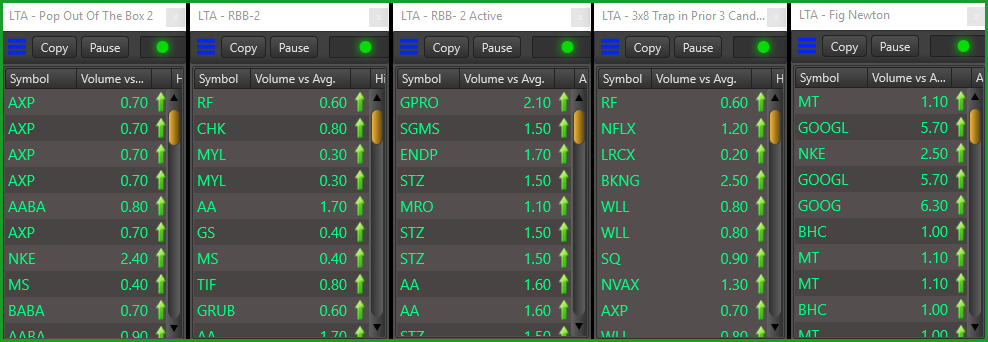
Today’s Action plan: Yesterday we closed our XOP for a nice profit. Today we will be managing our current trades and possibly taking a sweet 25% base hit on FDX. The LTA Scanner is already turned on, and we’re both ready for a great day.

✅ Trade-Ideas for consideration: ATVI, MOMO, PG, MA, CNCSA, PEP, TGT, CSCO

Free YouTube Education • Subscription Plans • Private 2-Hour Coaching
DISCLAIMER: Investing / Trading involves significant financial risk and is not suitable for everyone. No communication from Hit and Run Candlesticks Inc, its affiliates or representatives is not financial or trading advice. All information provided by Hit and Run Candlesticks Inc, its affiliates and representatives are intended for educational purposes only. You are advised to test any new trading approach before implementing it. Past performance does not guarantee future results. Terms of Service