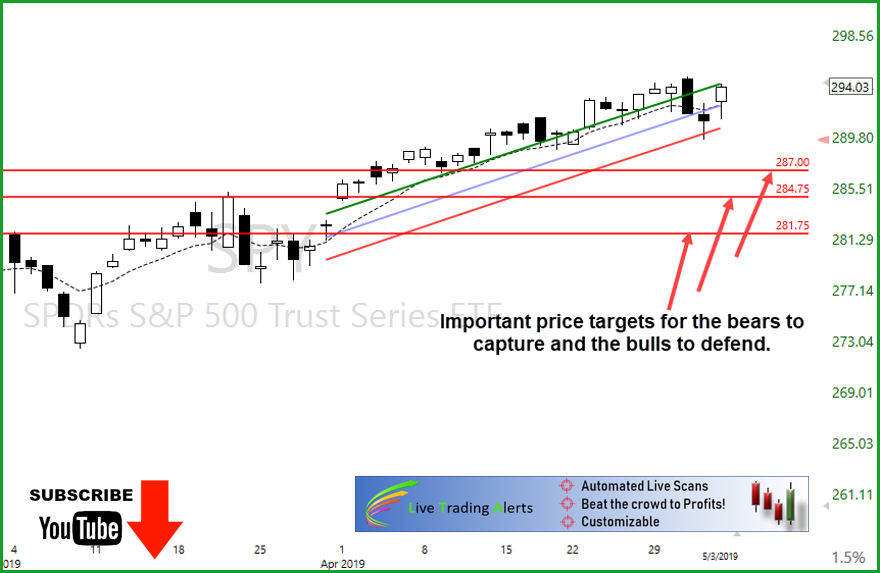
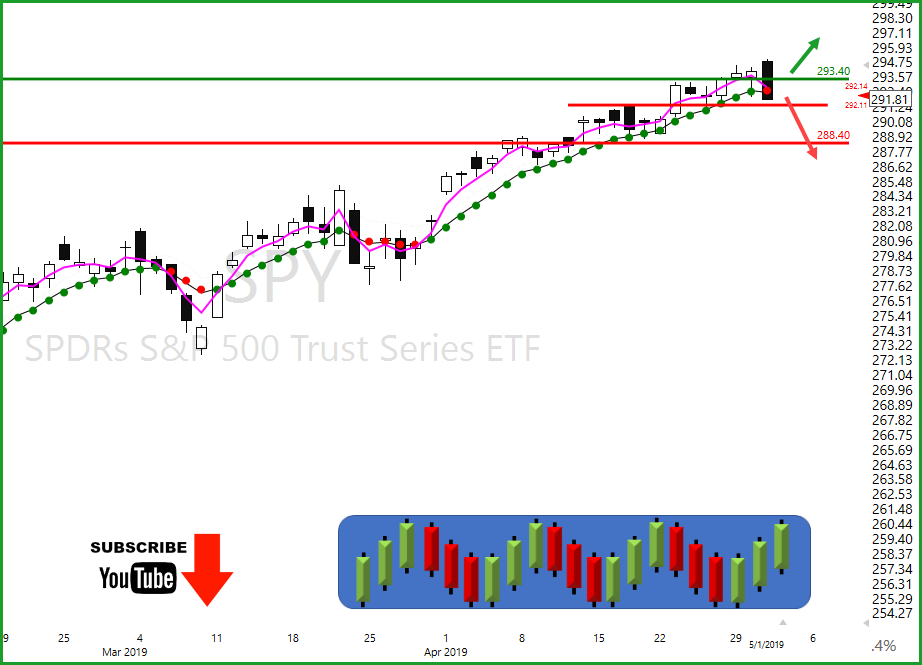
Did The SPY Recover?
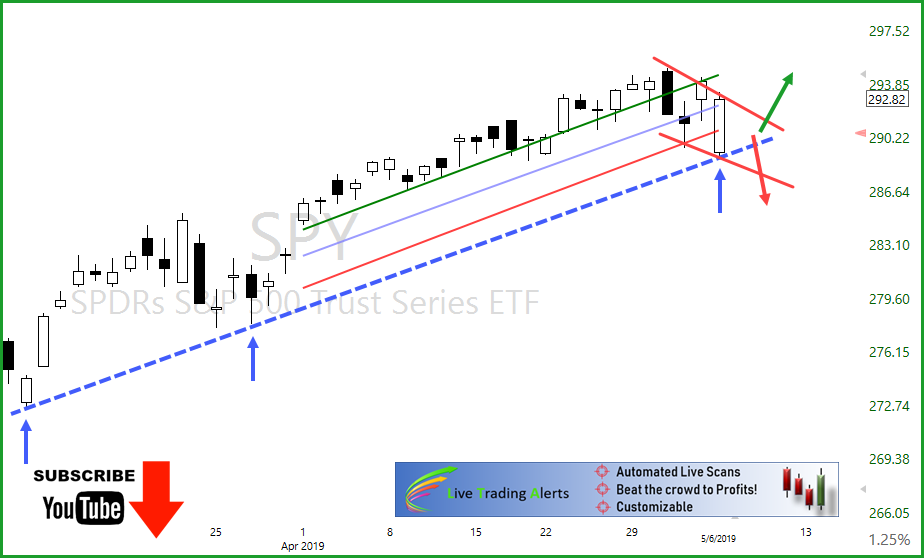
What a nice recovery in the SPY yesterday opened at $289.24 and closed at $292.82, also closed back in the T-Line Bands. Yesterday’s price action tested and bounced off the March 8, trendline. Here are a few of my concerns, May 1 was a Bearish Engulf with follow-through, then a challenge that failed and then there’s yesterday’s new low. So have a high/ low – lower high/ and a lower low. A close below the May 3, trendline and below yesterday’s low could trigger a bit more selling. No doubt yesterday’s candle (price action) was impressive but, it’s the following days that need follow-through that makes us money. THE VXX chart did close over the T-Line Bands and is in trend position to create a bullish pattern. Let’s all exert a little caution!
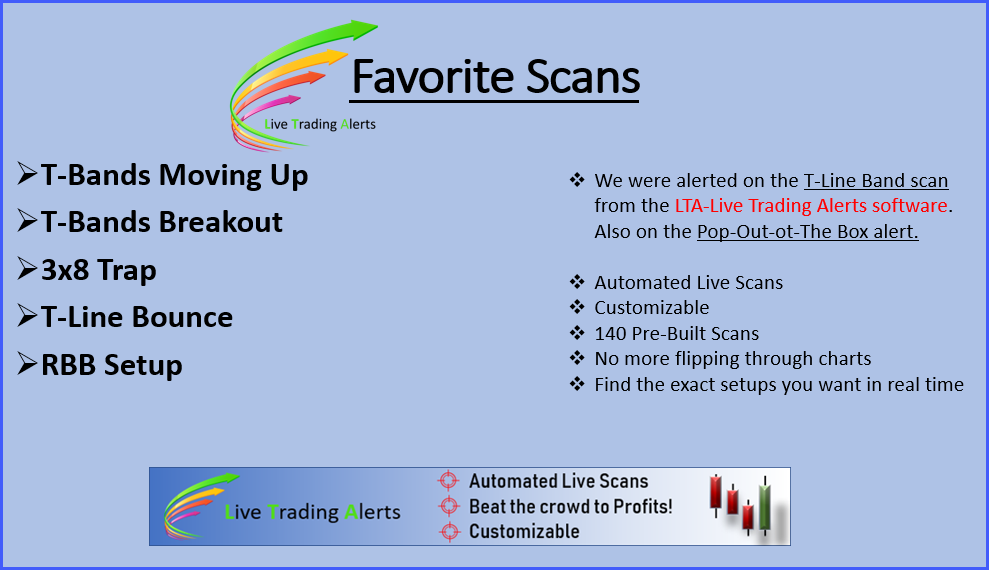
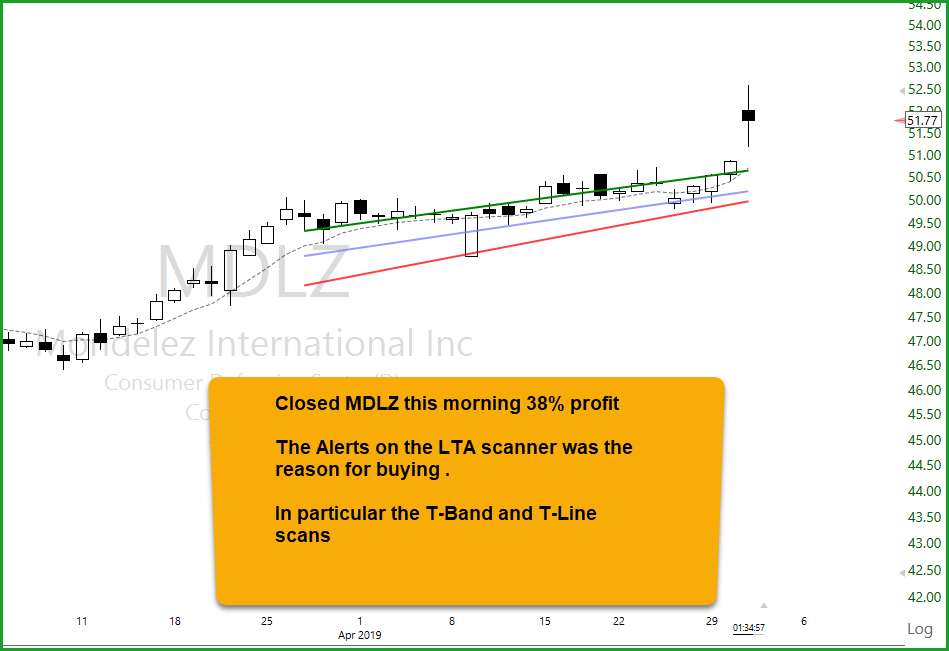
💰Yesterday we added to our SBUX trade on the pullback and bought ORCL. Both of these trades came from the LTA Alert Scanner Alerts
✅ 💰 Here are eleven tickers I am adding to a watchlist for consideration only. Trades may or may not be taken. VXX, SQQQ, XBI, SPXS, OLLI, ABT, SPXS, MJ, OECL, SBUX, AIG, GS.

Thanks To Our Moms
You are invited the Hit and Run Candlesticks and Right Way Options Trading Rooms!
Click this link: Registration for more details. Register and we will email you the login information. You will be able to come and go as you want for two days.
✅ Hit and Run Candlesticks Room Times; 8:10 am to market close
✅ Right Way Options Room Times; 11: am Eastern to 1: oo pm Eastern
11:00 am Eastern to 1:00 pm Eastern


Free YouTube Education • Subscription Plans • Private 2-Hour Coaching
DISCLAIMER: Investing / Trading involves significant financial risk and is not suitable for everyone. No communication from Hit and Run Candlesticks Inc, its affiliates or representatives is not financial or trading advice. All information provided by Hit and Run Candlesticks Inc, its affiliates and representatives are intended for educational purposes only. You are advised to test any new trading approach before implementing it. Past performance does not guarantee future results. Terms of Service