Interest Rate Cut?

Interest Rate Cut

According to new reports the Fed is leaning toward an interest rate cut and the prospect of low-cost money has futures suggesting a substantial gap up this morning.  Asian markets closed mixed but mostly higher overnight and although Europe is pondering a punishment for Italy’s continued deficit spending their indexes are bullish across the board this morning.  But does that mean we should throw caution to the wind and chase into this morning gap? No.

The fear of missing out is a powerful emotion but considering the magnitude of the move over the last 24 hours chasing in could prove to be a painful lesson in patience.  Consider the possibility of a pop and drop which would not be out the question after such a big reversal.  Gaps are gifts and I in fact will be looking at the morning gap as a reason to take profits.  Maintain your discipline waiting to see if buyers step up to support the morning gap before considering new long positions.

On the Calendar

calendar

On the hump day Earnings Calendar we have just under 30 companies reporting.  Among the notable are FIVE & VRA.

Action Plan

The top story splashed across my CNBC app this morning is “The Fed is indicating that a rate cut is coming”.  Markets love the prospect of lower cost money and we see both Asian and European exchanges rising on the hope.  Consequently, the US futures are signaling a sharp gap up this morning around 150 Dow points.  That would constitute about a 650 point rise in just over 24 hours.  As exciting as that is, too much of a good thing in such a short period could bring out the profit takers.

The fear of missing out is a very strong emotion but chasing into the open after such a big reversal in price can prove to be a very expensive lesson on patience.  A lesson, that had to be taught to me more times than I care to admit.  Rather than chasing into positions on big moves such as this I use it to take profits and scale out of trades.  Gaps are gifts that I tend to open regularly to collecting the gains and lowering the risk of the volatile price action.  I’m not trying to predict anything but this mornings gap could easily set up a pop and drop.   Stay focused and maintain your discipline waiting to see if buyers step up to support the morning gap before considering new long positions.

Trade wisely,

Doug

ROKU 3×8 Trap Setup

Yesterday 6/4/19 we closed ½ of SNAP for a sweet 27% base hit as the market began to draw to an end. We also picked up a little BABA ending the day up 11% based on the 60-min chart and an (RBB) Rounded Bottom Breakout. AIG and KO and AMD are doing fine and holding well.

POW! What a great day yesterday, price action took out our $280.10 line and pre-market today have already tagged our $282.50 line. Yesterday’s price action as great as it was, the SPY chart is still in a downtrend. When price closed over the downtrend line and constructed a bottom we will have a ton of nice long charts to choose from, but first thing first. The bulls will need to challenge the $283.00 line followed by $286.00. By following the 3×8 Trap, you will be able to see when the 3-EMA is above the T-Line, that will be a sign the SPY is in a bullish direction. At the close of yesterday, the trend is still down.

🎯 ROKU is one we are stalking today on our watchlist, ROKU is in a T-Line Run and yesterday was triggering on the LTA Scanner as a 3×8 Trap, and the LTA T-Line Band alert was going off “Sweet Spot-Sweet-Spot.” Members, be sure to be in the trading room about 9:10 Eastern when I’ll review the markets, trade ideas, and ROKU. More trade Ideas we will consider FSLR, CECE, LMT, AIG.

A Traders Edge In All Markets

The LTA Scanner can filter out charts that are trending, up or down and alert on charts that have Candlestick signals and patterns, western patterns and when indicators, such as MACD, Stochastics, RSI or Bollinger Bands have crossed or reaches the desired level. Hey, check out the NEW BULL PERFECT TREND ALERT. The right tools for the job.

6/5/2019 Acton Plan

  1. Plan relief rally trades
  2. Use our base hit strategy
  3. Fight the urge to predict a bottom
  4. Grow rich trading base hits
HRC Monthly service only $110 with this promo code: SAVE50

We use 2 of The Worlds Best Trading Tools, TC2000 for charting, LTA-Live Trading Alerts for real-time price action, candle and candle patterns, and western patterns. The right tools for the right job.👍

Free YouTube Education  •  Subscription PlansPrivate 2-Hour Coaching

DISCLAIMER: Investing / Trading involves significant financial risk and is not suitable for everyone. No communication from Hit and Run Candlesticks Inc, its affiliates or representatives is not financial or trading advice. All information provided by Hit and Run Candlesticks Inc, its affiliates and representatives are intended for educational purposes only. You are advised to test any new trading approach before implementing it.  Past performance does not guarantee future results.  Terms of Service

Anti-Trust Investigations

Anti-Trust Investigations

With the news the DOJ may begin anti-trust investigations of Google, Amazon and Facebook the QQQ dipped into correction territory yesterday.  Amid all the current market uncertainty they choose now to pile on more uncertainty?  There timing is impeccable considering that Fed member James Bullard said it might be necessary to lower rates sooner than later to deal with the economic impacts as the trade war uncertainty persist.

Futures are pointing to gap up open around 100 Dow points and perhaps signaling a relief rally may be in order.  Remember a relief rally can be very brief so don’t mistake a little short covering as a recovery.  We have significant technical damage that needs to be repaired as well as key price resistance levels above that must be reclaimed before recovery can begin.  Consider your risk carefully and remember price volatility is likely to remain high.

On the Calendar

calendar

On the Earnings Calendar we have just 19 companies reporting quarterly results.  Notable reports include GME, CRM, CBRL & TIF.

Action Plan

It seems rather remarkable amid trade war concerns, Mexican tariffs and global slow down worries the DOJ has decided to begin anti-trust investigations against Google, Amazon and Facebook after years of complaints.  Their timing is impeccable don’t you think?  James Bullard a voting member of the CBOE suggested yesterday that trade war concerns may warrant a reduction in the interest rate raising fears of economic impacts.  His comments created significant price volatility as the market grappled with the implications.

US Futures are currently suggesting a gap up of more than 100 points this morning and perhaps signaling a relief rally to test resistance levels of price and downtrend.  There is tremendous technical damage so I would not expect the bulls to rush back in a big way but perhaps we have found at least a short-term bottom after the QQQ officially reached correction territory yesterday.  Be careful not to chase the morning gap to avoid the possible pop and drop pattern like we experienced yesterday.  Remember volatility is likely to remain high so intra-day whips and reversals may challenge the resolve of even the most experienced traders.

Trade Wisely,

Doug

AIG Setting Up

We covered, or PG put yesterday for a 14% profit after the Bullish Harami on the daily chart and the chart pattern of the 15-min and 60-min charts. AMD did not trigger yesterday, AMD failed to break out into the pattern buy area, but we will wait and be patient. AIG is setting up inside the T-Line Bands currently a PBO winding up for a J-Hook continuation pattern. Learn more in our live trading room.

Yesterday was the second day below the 200-SMA and came within .67 of testing the March 8 low. Make no mistake the sellers are controlling the current trend, but even the bears allow relief rallies if only to bring in new sheep. Yesterdays Doji may have been enough indecision to produce a relief rally. Yesterday I mentioned I saw a few bright spots in the charts; this could be the beginning. A relief rally to about $280.10 would make sense because of the recent support/resistance. The VXX chart has backed off overnight, opening the door for the buyers to open the door. Remember it’s the close today that counts. The FNGU 15-min chart shows price over the T-Line pre-market, the question now is can the buyers hold there course.

A Traders Edge In All Markets

The LTA Scanner can filter out charts that are trending, up or down and alert on charts that have Candlestick signals and patterns, western patterns and when indicators, such as MACD, Stochastics, RSI or Bollinger Bands have crossed or reaches the desired level. Hey, check out the NEW BULL PERFECT TREND ALERT. The right tools for the job.

6/4/2019 Acton Plan

  1. Plan relief rally trades
  2. Use our base hit strategy
  3. Fight the urge to predict a bottom
  4. Grow rich trading base hits

HRC Trades Ideas

✅ We are adding the following to our possible trade list, CECE, AIG, TGT, TPX, LMT, KMX. Trade wisely

HRC Monthly service only $110 with this promo code: SAVE50

We use 2 of The Worlds Best Trading Tools, TC2000 for charting, LTA-Live Trading Alerts for real-time price action, candle and candle patterns, and western patterns. The right tools for the right job.👍

Free YouTube Education  •  Subscription PlansPrivate 2-Hour Coaching

DISCLAIMER: Investing / Trading involves significant financial risk and is not suitable for everyone. No communication from Hit and Run Candlesticks Inc, its affiliates or representatives is not financial or trading advice. All information provided by Hit and Run Candlesticks Inc, its affiliates and representatives are intended for educational purposes only. You are advised to test any new trading approach before implementing it.  Past performance does not guarantee future results.  Terms of Service

Global Trade Uncertainty.

Global Trade Uncertainty

As the President makes a European tour and dines with the Queen global trade uncertainty are having seeing impacts on markets around the world.  Asian markets closed lower and European are also in the red this morning on the deepening uncertainty.  US futures have recovered significantly from overnight lows but continue to point to lower open this morning.

There is nothing to inspire the market on the Earnings Calendar this morning so hopefully the PMI & ISM numbers will help provide some clarity to calm the nerves of traders and investors.  Although we can expect the price action volatility to very challenging the short term oversold condition could provide us at least a modest relief rally in the near future.  Unfortunately, considerable technical damage and price resistance above does not favor a speedy recovery unless we find some resolutions to the trade uncertainty.

On the Calendar

calendar

On the Earnings Calendar we have just 20 companies reporting with nothing particularly notable today.

Action Plan

Swirling uncertainty continues to plague the market as China ramps up the rhetoric issuing a white paper blaming the US for the Trade War.  Asian markets closed modestly lower across the board.  As the president makes a European tour there markets are also modestly lower as global trade worries deepen.  As a result, US Futures reflected the uncertainty being down nearly 175 points during the night but slightly recovering as we move toward the open.

Perhaps the PMI Mfg, ISM Mfg and Construction Spending reports on the Economic Calendar this morning can help to provide some clarity and settle the nerves of traders and investors.  As the technical damage deepens expect price action volatility to remain very challenging with sudden overnight and even intr-day new driven reversals.  Anything is possible if more bad news is released but the short-term oversold condition will have me watchful for at least a modest relief rally in the near future. 

Trade Wisely,

Doug

200-SMA Tested

Last week we bought PG- Procter & Gamble, August $110 Puts as price action was showing signs of weakness and failing the 50-SMA. At Friday’s close, the sellers still outnumbered the buyers. To learn more about the PG put currently up 23% join us in the HRC Trading Room.

The sellers continue to dominate the with another lower close Friday. Fridays gapped and closed right through the 200-SMA also closing below the Dotted Deuce. The March 8th low $274.45 seems likely as the next possible test for price action on the daily chart. This summer is the summer of the trade war and more importantly, a summer to respect the trend. In our efforts to remain profitable, we find that going back to basics is the best approach. Trade with the trend, when the market trend is down, we find it easier to make money shorting or buying puts. We will hold fast to our trading rules and continue to trade for base hits. Let us all be care full not to overtrade or try to force trades because we think we have to trade something every day.

A Traders Edge In All Markets

The LTA Scanner can filter out charts that are trending, up or down and alert on charts that have Candlestick signals and patterns, western patterns and when indicators, such as MACD, Stochastics, RSI or Bollinger Bands have crossed or reaches the desired level. Hey, check out the NEW BULL PERFECT TREND ALERT. The right tools for the job.

6/1/2019 Acton Plan

  1. Trade with the current trend of the SP-500
  2. Expose less money to each trade.
  3. Fight the urge to predict a bottom
  4. Grow rich trading base hits
Worlds #1 Live Alert Scanner

HRC Trades Ideas

✅ We are adding the following to our possible trade list, MRCY, PG, BOLD, CMG, ACAD, SAFM. Trade wisely

HRC Monthly service only $110 with this promo code: SAVE50

We use 2 of The Worlds Best Trading Tools, TC2000 for charting, LTA-Live Trading Alerts for real-time price action, candle and candle patterns, and western patterns. The right tools for the right job.👍

Free YouTube Education  •  Subscription PlansPrivate 2-Hour Coaching

DISCLAIMER: Investing / Trading involves significant financial risk and is not suitable for everyone. No communication from Hit and Run Candlesticks Inc, its affiliates or representatives is not financial or trading advice. All information provided by Hit and Run Candlesticks Inc, its affiliates and representatives are intended for educational purposes only. You are advised to test any new trading approach before implementing it.  Past performance does not guarantee future results.  Terms of Service

Punitive Tariff Increases

With illegal boarders crossings reportedly rising to 4500 per day the President shocked the market yesterday afternoon with punitive tariff increases on Mexican goods.  The tariffs will begin with a 5% increase on June 10th with an increase to 10% in July and 25% in October unless Mexico takes steps to stem the tide of illegal crossings.

The shock and uncertainty of this action have the futures pointing to a substantial gap down this morning that threatens to break some key price support levels.  Raising this much uncertainty ahead of the weekend has the potential to create some panic among already battered traders and investors.  Buckle up the road could be very bumpy ahead.

On the Calendar

A light day on the Earnings Calendar as we begin to wind down the second quarter earnings season.  The only particularly notable report today is BIG coming out before the bell.

Action Plan

Yesterday’s choppy price action reflected the uncertainty the faces leaving behind more questions than answers.  After the bell the President then surprised the everyone announcing he will raise tariffs on Mexico by June 10th if they don’t begin to stem the tide of illegal crossings that are overwhelming border enforcement.  According to reports the US is currently holding over 80K illegals with approximately 4500 added each day.  According to the Whitehouse the tariffs will be at 5% and increasing to 10% in July and 25% shortly after that if the problem persists.

This morning the futures are reacting strongly to the surprising news suggesting a gap down of more than 200 Dow points at the open.  Grappling with the possible ramifications and uncertainty of it all has the potential to trigger a bit of panic selling if key supports fail with the weekend approaching.  The best we can do is stay focused on the price action and disciplined to our rules, avoiding emotional decision making that often creates costly mistakes.

Trade wisely,

Doug

A glimmer of hope for a relief rally.

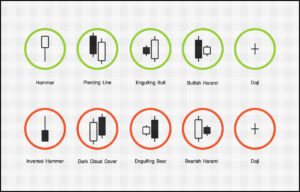
Although yesterday’s selloff created a lot of technical damage it also offered a glimmer of hope for at least a little relief rally.  With the Dow having tested the psychological support of 25,000 and the SP-500 testing its 200-day average both indexes left behind hammer candle patterns that indicate at least a short-term bottom is possible.  Keep in mind that hammer patterns require follow through to be confirmed and that relief rallies may be very short-lived but a little break in the selling would is nice just the same.

Currency fluctuations, slipping bond rates and sharply rising grain commodities will continue to weigh heavily on the mind of the market let alone the happens in the trade war.  The market is still very sensitive to the news cycle so stay on guard for the possibility of very quick reversals and high price volatility to continue challenging traders skills. 

On the Calendar

calendar

On the Earnings Calendar we have just under 60 companies reporting today.  Among the notable reports DG, COST, BURL, CSIQ, DELL, DLTR, EXPR, GME, GPS, LULU, MOV, NTNX, ULTA & VMW.

Action Plan

Spending considerable time looking through charts last night there is now widespread technical damage across the majority of market sectors.  Having said that there is also a glimmer of light for a relief rally after the DIA tested 250 and the SPY found support at its 200-day average yesterday.  Please note that I didn’t say recovery because there is still a lot of work needed before occurs but a little relief rally would certainly be nice even if it’s very short lived.

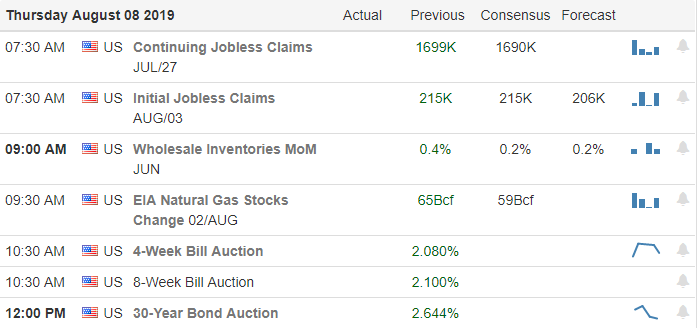
Although currency fluctuations and slipping bond rates have the market on edge future are currently pointing to a modestly higher open today.  The GDP number, International Trade report and weekly Jobless Claims that all come out at 8:30 AM Eastern could lift the market spirits or dampen them quickly if the numbers disappoint.  Expect price action volatility to remain very challenging with quick reversals due to news sensitivity. 

Trade Wisely,

Doug

Hammer, 200-SMA, Lots To Consider

The SPY printed a Hammer yesterday after a gap down finding the 200-SMA as we have been talking about the past week, on fairly strong volume yesterday. The T2122New High/Low Ratio chart from TC2000 is at a low 4.35.  The weekly chart is sitting on the 50-period moving average while the monthly chart is printing a Bearish Engulf, there no doubt the sellers are holding the cards, the buyers are just not giving up very easy. Bullish follow-through above yesterdays Hammer (above $278.90) should produce a small relief rally to maybe to the $280.60 area. Many reading this knows how much I like the RBB chart setup, and the VXX is, in fact, one of these setups. Price is now above the 50-SMA and looks to be determined to challenge the 200-SMA. The VXX has challenged the 200-SMA a couple of time the last few months, and if the VXX can stay below the 200-SMA, the markets should be safe from disaster but not choppy trading. If the VXX finds a path above the 200-SMA, the market could be in a little trouble. Good trading my friends.

A Traders Edge In All Markets

The LTA Scanner can filter out charts that are trending, up or down and alert on charts that have Candlestick signals and patterns, western patterns and when indicators, such as MACD, Stochastics, RSI or Bollinger Bands have crossed or reaches the desired level. Hey, check out the NEW BULL PERFECT TREND ALERT. The right tools for the job.

5/30/2019 Acton Plan

  1. Consider the trend of the SPY, DIA’s IWM, and the QQQ’s when trading, it is easier to make money trading with the trend.
  2. 85% of all stocks follow the trend of the SP-500
  3. Don’t try to time the exact turn or trend change of chart
  4. Manage current trades looking for base hits.
  5. Welcome small losses
  6. Trade smaller, less capital in a position
  7. Fewer positions
  8. Trade strong, stable charts, not one-day wonders
  9. Trade with the trend of the chart
  10. A trading plan for each trade.
Worlds #1 Live Alert Scanner

Trades Ideas

AMD has broken above the T-Bands suggesting bullishness, I am considering a trade above $29.10 and only on an acceptable entry pattern. To learn more join us in the trading room, we will discuss AMD and more Trade-Ideas as well.

HRC Monthly service only $110 with this promo code: SAVE50

We use 2 of The Worlds Best Trading Tools, TC2000 for charting, LTA-Live Trading Alerts for real-time price action, candle and candle patterns, and western patterns. The right tools for the right job.👍

Free YouTube Education  •  Subscription PlansPrivate 2-Hour Coaching

DISCLAIMER: Investing / Trading involves significant financial risk and is not suitable for everyone. No communication from Hit and Run Candlesticks Inc, its affiliates or representatives is not financial or trading advice. All information provided by Hit and Run Candlesticks Inc, its affiliates and representatives are intended for educational purposes only. You are advised to test any new trading approach before implementing it.  Past performance does not guarantee future results.  Terms of Service

The hits keep coming.

The hits keep coming

The market could sure use a positive story but today the hits keep coming.  The US as nine countries to their monitoring list of possible currency manipulators.  China threatens to withhold rare earth minerals essential to technology manufacturers.  Extreme weather and flooding across the majority of the gain belt is seriously delaying crop planting raising commodity prices sharply and raising concerns about future food prices.

Currently futures are pointing to a substantial gap down at the open threatening to break important price support levels this morning.  The odds of a 200-day moving average test in SPY and the QQQ are rising and Dow could easily slip to 25,000 if the sellers begin to pile on and fear of global slow down grows.  Expect increased volatility in prices and keep an eye on VIX as fear could quickly spike.

On the Calendar

calendar

Less than 40 companies expected to report earnings today with retail in the spotlight.  Notable reports include, ANF, UHAL, BMO, CHS, DAKT, DKS, GES, PANW, PVH, TLYS, VEEV & VRNT.

Action Plan

Markets around the world are reacting negatively this morning as currencies decline and commodities soar. The US added nine countries to its monitoring list of potential currency manipulators.  As a result the currencies weakened against the dollar putting pressure on stock prices.  In the next move of the trade war, China threatens to cut off rare earth minerals which are essential to technology companies.  Adding insult to injury grain commodity prices are rising sharply as weather events in the US have seriously delayed crop planting as flooding across the grain belt continues this spring.

Futures are pointing to a triple-digit gap down this morning with the all four of the major indexes threatening to open below key support levels.  If the seller pile on this morning we could see the DIA slip to 250, the SPY tests its 200-day average around 277 with the QQQ’s doing the same around 174.  Keep a close eye on the possibility of a fear spike that could greatly increase price volatility for the near future.

Trade Wisely,

Doug