A traders code for (Bullish trends), Higher highs and lower lows, and the opposite for (Bearish trends) Lower lows and Lower highs. The following charts have been following the bearish code. IYT, SMH, FDX, and COPX are a few charts I watch to get the pulse of the market. You can get the same picture by using three moving averages such as The 3-EMA, T-Line, and 34-EMA, another popular combo is the 3-EMA, T-Line, and17-EMA or simply three moving averages that make sense to that fit in your trading world. When you look at the above charts and the moving average groupings what do you see?
Trading Room Open House
Hit and RunCandlesticks and Right Way Options have opened our doors
Watchlist Ideas
Becauseof technical issues, we will not have any trade ideas for the watchlist today.After the market open the LTA scanner will find up more we can trade. Thank you for your understanding.
Yes, The Little Account Can!
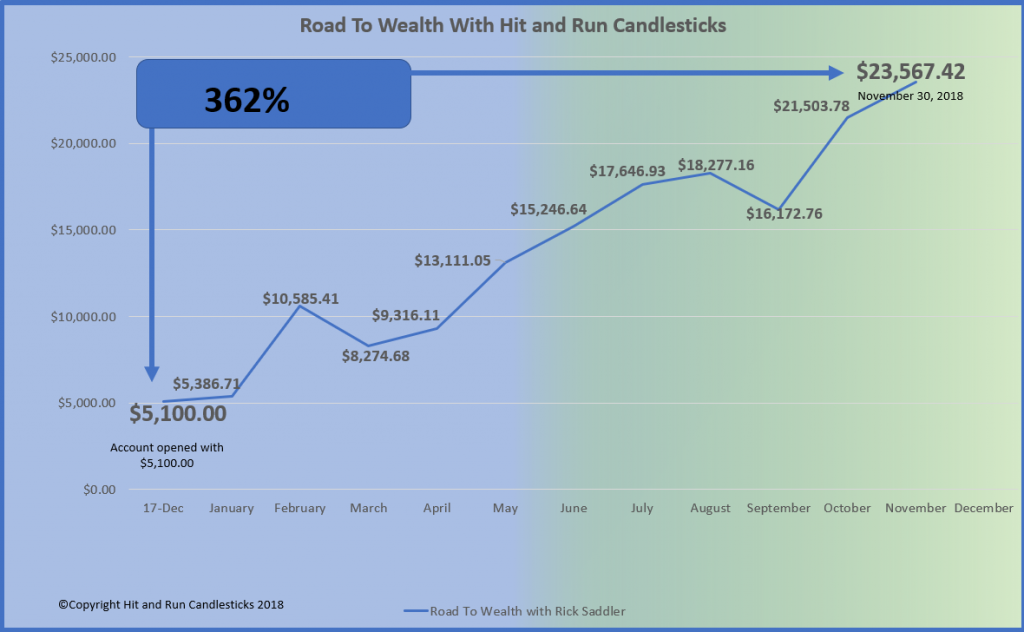
For 2019 Rick plans on taking the now $23,567.00account to $50,000.00 before December 31, 2019. Remember he already has increased the account $5,000.00 to $23,567.00 or 362% in 2018. Would you like to learn from someone that truly makes money, not just one hit wonders and backs it up with his account statement.

Trading Services We Offer
Free YouTube Education • Subscription Plans • Private 2-Hour Coaching
DISCLAIMER: Investing/ Trading involves significant financial risk and is not suitable for everyone. No communication from us should be considered as financial or trading advice. All information provided by it and Run Candlesticks Inc, its affiliates or representatives is intended for educational purposes only. You are advised to test any new approach before implementing it. Past performance does not guarantee future results. Terms of Service


Comments are closed.