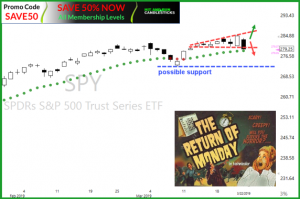
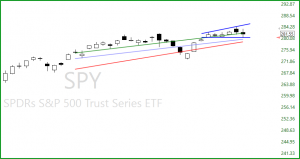
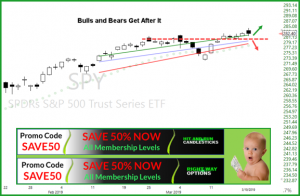
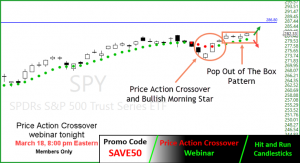
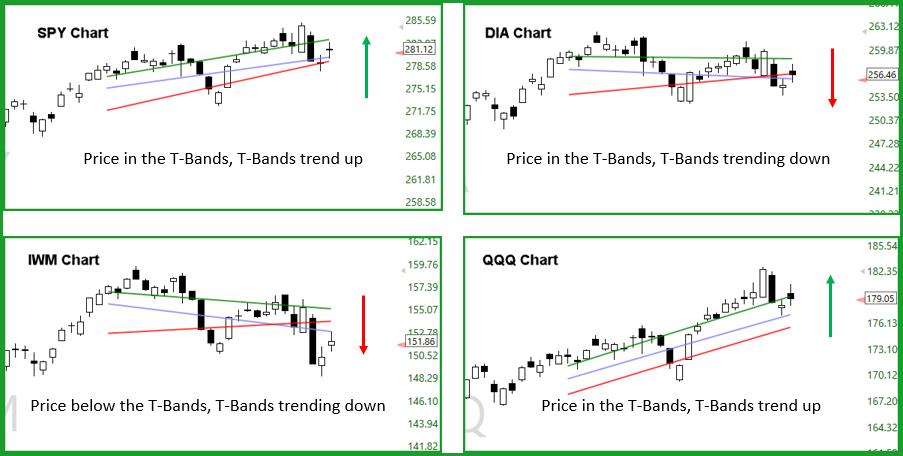
The SPY closed above the February high yesterday giving the bull another shot of Adrenalin to climb the wall if worry. The continuation pattern coming off the Red/Green Trendicator seems in good shape. The Red/Green is trending and the T-Line is trending above, when the engine runs it runs well. The next challenge for the bulls should be around $278.15 and a close below $270.00 good give the bear a little hope. The VIX-X chart is showing no fear hiding out under the Red/Green trend. We are still on vacation in Alaska, I have lived most of my life and it still amazes me.
Here are 4 stocks I am interested in, I will be looking for bullish follow through and positive trading. SNAP, AA, STZ, JUJ
Live Trading Alerts News
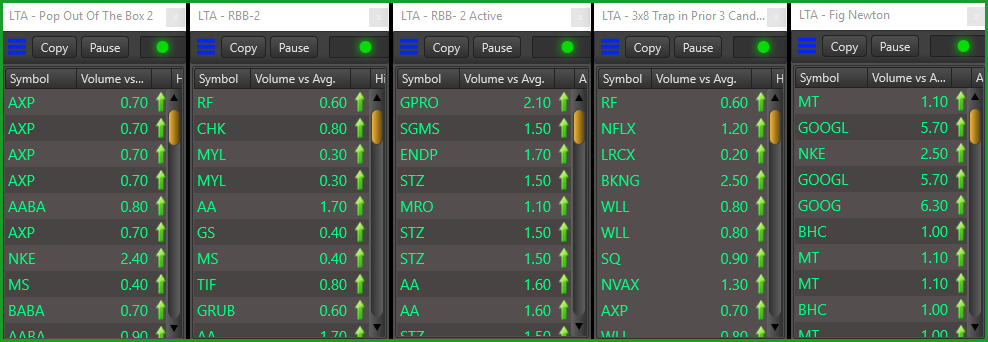
Two new auto scans have been added to the LTA-Live Trading Alerts Scanner; the Bull -Fig Newton patternand the Bear- Oreo Pattern. With over 100 built-in scans my favorite bullish scans are the Pop Out of The Box, The RBB, The 3×8 Trap, The Fig Newton. If you need set with the scanner set up or adding scans just let us know. Each day (Market hours) we provide Free Scanner coaching in our training room.
DISCLAIMER: Investing/ Trading involves significant financial risk and is not suitable for everyone. No communication from us should be considered as financial or trading advice. All information provided by it and Run Candlesticks Inc, its affiliates or representatives is intended for educational purposes only. You are advised to test any new approach before implementing it. Past performance does not guarantee future results. Terms of Service
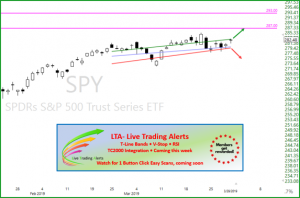
For the past three days the SPY has been building a Bullish Continuation pattern and with the Government shut down deal I would suspect today will be another building block to the bullish continuation pattern. The Red/Green Trendicator is rising and price action is constructing a bullish pattern. I like that the T2122 chart has headed back up, but I don’t really like that it is back in the overbought area. Watch price action and always keep the trend in you favor.
FYI: I am in Alaska on vacation and yesterday I closed MDLZ for a nice 55% profit while looking at the beautiful Eagle River mountains and the sun come up. Here’s a nice way to start the day looking over the Keni River. I love being a stock trader.
Live Trading Alerts News
Two new auto scans have been added to the LTA-Live Trading Alerts Scanner; the Bull -Fig Newton patternand the Bear- Oreo Pattern. With over 100 built-in scans my favorite bullish scans are the Pop Out of The Box, The RBB, The 3×8 Trap, The Fig Newton. If you need set with the scanner set up or adding scans just let us know. Each day (Market hours) we provide Free Scanner coaching in our training room.
DISCLAIMER: Investing/ Trading involves significant financial risk and is not suitable for everyone. No communication from us should be considered as financial or trading advice. All information provided by it and Run Candlesticks Inc, its affiliates or representatives is intended for educational purposes only. You are advised to test any new approach before implementing it. Past performance does not guarantee future results. Terms of Service
In this 1-hour overview, Rick Saddler founder of Hit and Run Candlesticks talks about his trading routine throughout the day. Hopefully, this will help answer questions for fellow traders.
Rick Saddler has been swing trading for the past 31 years and loves to share his experiences with candlestick signals and candlestick patterns. Trading with price action and chart patterns have been the key to 307% trading profits in 2018.
The charts in this video are for educational purposes only. No
communication from Hit and Run Candlestick Inc should be considered as
financial or trading advice. Past performance does not guarantee future
results.
Live Trading Alerts News
Two new auto scans have been added to the LTA-Live Trading Alerts Scanner; the Bull -Fig Newton patternand the Bear- Oreo Pattern. With over 100 built-in scans my favorite bullish scans are the Pop Out of The Box, The RBB, The 3×8 Trap, The Fig Newton. If you need set with the scanner set up or adding scans just let us know. Each day (Market hours) we provide Free Scanner coaching in our training room.
DISCLAIMER: Investing/ Trading involves significant financial risk and is not suitable for everyone. No communication from us should be considered as financial or trading advice. All information provided by it and Run Candlesticks Inc, its affiliates or representatives is intended for educational purposes only. You are advised to test any new approach before implementing it. Past performance does not guarantee future results. Terms of Service
So the question is, do we buy, sell or hold? Let’s take a look at the chart, from the December lows the bulls have built a bullish trend, and the trend is still intact. Price action trend has been as of yesterdays close still is making new highs/higher lows. February 5, price action made a new high and is now pulling back toward the bullish trendline. The TC2000 T2122 chart was pegged and has now rolled over signaling a pullback.
Here is what we have done with this information, at the recent high we profited on a few winning long positions and have bought PUTS on the market. Yesterday we profited on a few of the PUTS, and now we are closely managing a few positions waiting for the SPY to give us a clue as it moves closer to the bullish uptrend line. We currently see this pullback as a bullish buying opportunity as long as price action stays above the trend. The key now is to identify the right price action buy/sell signal.
Live Trading Alerts News
Two new auto scans have been added to the LTA-Live Trading Alerts Scanner; the Bull -Fig Newton patternand the Bear- Oreo Pattern. With over 100 built-in scans my favorite bullish scans are the Pop Out of The Box, The RBB, The 3×8 Trap, The Fig Newton. If you need set with the scanner set up or adding scans just let us know. Each day (Market hours) we provide Free Scanner coaching in our training room.
DISCLAIMER: Investing/ Trading involves significant financial risk and is not suitable for everyone. No communication from us should be considered as financial or trading advice. All information provided by it and Run Candlesticks Inc, its affiliates or representatives is intended for educational purposes only. You are advised to test any new approach before implementing it. Past performance does not guarantee future results. Terms of Service
The bear is getting hangry; the bears are getting a little hangry since they only snacked six/seven days ago are have not had a big meal for about a month. The narrowing chart pattern is a clue that the current trend is getting tired and needs a rest. A few other clues are price action is pressed up against the 200-SMA, the T2122 4wk New High/Low Ratio is way overextended, and the FNUG daily chart closed with a Dark Cloud Cover yesterday. It looks like we are going to have an Evening Star open on the SPY and depending on the following price action/candle action the bulls might find support around $269.00, if not the $266.70 and $264.50 areas are open. Right now we will look at this bull back and bullish opportunity providing the bulls step in above $266.70. Cautiously bullish with a few short trades for balance.
Yesterday the Hit and Run Candlesticks “Road To Wealth” Account grabbed another $300.00 profit on the X trade.
2/7/2019 trade-ideas: we are adding the following to our watch list, (Long-OSTK, GRUB, ONB, MDLZ) (Short-CME, RAMP, AMZN, TTWO. Past performance does not guarantee future results
Live Trading Alerts News
Two new auto scans have been added to the LTA-Live Trading Alerts Scanner; the Bull -Fig Newton patternand the Bear- Oreo Pattern. With over 100 built-in scans my favorite bullish scans are the Pop Out of The Box, The RBB, The 3×8 Trap, The Fig Newton. If you need set with the scanner set up or adding scans just let us know. Each day (Market hours) we provide Free Scanner coaching in our training room.
DISCLAIMER: Investing/ Trading involves significant financial risk and is not suitable for everyone. No communication from us should be considered as financial or trading advice. All information provided by it and Run Candlesticks Inc, its affiliates or representatives is intended for educational purposes only. You are advised to test any new approach before implementing it. Past performance does not guarantee future results. Terms of Service
Twenty-two days in a row, that’s how many days price action has closed over the T-Line, price action has cut through every obstacle the bears have had. Now price is faced with the 200-SMA hurdle with right price action anything is possible. At the close yesterday, the SPY chart closed with a gap in the morning followed by a fairly tight trading day closing with Doji pinned just under the 200-SMA. The VIX pricked up a few buyers, not enough to panic but we should keep an eye on the price action. IYT and SMA have been in a solid T-Line run, and both are pinned just under the 200-SMA. We remain cautiously bullish above $269.19 on the SPY chart.
Yesterday the Hit and Run Candlesticks “Road To Wealth” Account grabbed another $500.00 or 19%with the SQ trade. The LTA Scanner gave a great alert on X; we are currently up 19%.
2/6/2019 trade-ideas: we are adding the following to our watch list, PCG, DISH, SBUX, WYNN, WY, CZR, UNP. Past performance does not guarantee future results
Live Trading Alerts News
Two new auto scans have been added to the LTA-Live Trading Alerts Scanner; the Bull -Fig Newton patternand the Bear- Oreo Pattern. With over 100 built-in scans my favorite bullish scans are the Pop Out of The Box, The RBB, The 3×8 Trap, The Fig Newton. If you need set with the scanner set up or adding scans just let us know. Each day (Market hours) we provide Free Scanner coaching in our training room.
DISCLAIMER: Investing/ Trading involves significant financial risk and is not suitable for everyone. No communication from us should be considered as financial or trading advice. All information provided by it and Run Candlesticks Inc, its affiliates or representatives is intended for educational purposes only. You are advised to test any new approach before implementing it. Past performance does not guarantee future results. Terms of Service
I love following a chart like the SPY that is trending and when price action gives us PBO’s (Pull Back Opportunities) followed by profitable swings. January 24th through January 30th was a perfect PBO opportunity with a swing to the Dotted Deuce and now possibly the 200-SMA on the SPY chart. When looking at the SPY, it is clear to see that the bulls have been in control climbing the wall of worry fending off the very obvious resistance starting on the January 15th candle. Unfourtiountly the bullishness can end in a split second, above $269.15 and up to $281.20 we feel will be like sailing through rough waters. Our navigation will be crucial getting past the rocks, sharks and pirates.
Yesterday the “Live Trading Alerts Scanner” alerted us on a few great setups; I was able to capture terrific entries on X and GS. Now we will manage them based our proven trading rules. Three of my favorite scans are the Pop Out of The Box, The RBB, and the 3×6 Trap. Yesterday we took profits on V, and WDC both alerted by the Live Trading Alerts Scanner. Todays trade-ideas came from Live Trading Alerts at the closing bell yesterday: NBR, X, LMT, URI, BBBY, HOME, IBM. Not all charts are a buy today, knowing trade ideas still require trading education and savvy. Past performance does not guarantee future results.
DISCLAIMER: Investing/ Trading involves significant financial risk and is not suitable for everyone. No communication from us should be considered as financial or trading advice. All information provided by it and Run Candlesticks Inc, its affiliates or representatives is intended for educational purposes only. You are advised to test any new approach before implementing it. Past performance does not guarantee future results. Terms of Service
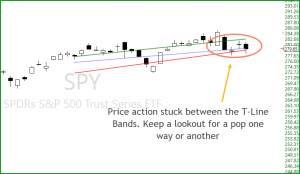
The battle between Bullish and Bearish is up front and center lately. On Friday the SPY daily chart closed with a Doji in the thick of resistance, the trend remains bullish with price leading the T-Line and the T-Line leading the 34-EMA. The 20-SMA and 34-EMA have risen above the 50-SMA. Friday’s price action felt the pressure of the bearish downtrend line and the 200-SMA is trying to intimidate price. The area surrounding the 200-SMA ($270.30 and $277.65) will likely be a challenge for price action. Price is currently at our Dotted Duece line, success over the Dotted Duece should result in a challenge of the 200-SMA. Both areas will take the full power of the Bull, keep a watchful eye out for that sneaky little Bear. We are concerned about the T2122 levels in TC2000 pegged above 80 for so long. These high levels are concerning and a warning clue. BUT price and trend is king, and as long as price action remains bullish over the RED/GREEN Trendicator, we will remain cautiously bullish. The CBOE Market Volatility Index (VIX) The CBOE Market Volatility Index (VIX) price action is showing no signs of fear with price below the T-Line and the T-Line below the Re/Green line.
From out trade-idea list: NBR, KKR, WDC, MU, NTAP, NYL, LVS, HAL will be talked about in our pre-market workshop. Past performance does not guarantee future results.
DISCLAIMER: Investing/ Trading involves significant financial risk and is not suitable for everyone. No communication from us should be considered as financial or trading advice. All information provided by it and Run Candlesticks Inc, its affiliates or representatives is intended for educational purposes only. You are advised to test any new approach before implementing it. Past performance does not guarantee future results. Terms of Service
What fantastic day yesterday, heck what a fantastic month January has been, check the Thursday, January 31, end of day blog post. You can see what a few our members did. If your We are kicking February off with a 30% discount on our membership. I will also be offering 1-hour free coaching for the first ten that takes advantage of the 30% discount!
The SPY closed higher yesterday at $269.93 on the HRC Dotted Deuce Line. The follow-through yesterday extended the bullish J-Hook continuation as well. As of yesterdays close the bulls have ignored and resistance the bears have tried to put up. In our recent blogs and the trading room, I have stated we are cautiously bullish. Yesterday we practiced Base Hits and closed all the good profitable positions and now getting more interested in adding a PUT or two. The TC2000 T2122 chart is pegged at 98.56, I for one have never seen the T2122 this high for this long. On the Bull side, price continues to ride the T-Line, and the T-Line is riding the Red/Green Trendicator Line. For the Bears, the resistance is in please, now it’s up to the bulls to what they are going to do with that information.
The CBOE Market Volatility Index (VIX) Closed at another low yesterday on the 200-SMA. It seems there is no fear in this market, at least for now.
DISCLAIMER: Investing/ Trading involves significant financial risk and is not suitable for everyone. No communication from us should be considered as financial or trading advice. All information provided by it and Run Candlesticks Inc, its affiliates or representatives is intended for educational purposes only. You are advised to test any new approach before implementing it. Past performance does not guarantee future results. Terms of Service
Check out what a few members posted in the trading room today! It’s so fun pulling profits from the market. You gotta love the base hits.
(09:47 am) Malcolm M: I held my AMD, 16% today so far. (09:47 am) Aaron the red baron: 76% on AMD, can I get 100% today… (09:48 am) kirk p: HRC team, Just wanted to say thank you for all you do. My education has skyrocketed since I joined last May. You are appreciated! (09:49 am) Malcolm M: Ditto Kirk.. both my Mental Equity has appreciated and my Financial Equity has grown. (09:50 am) Ian Smith: Kirk I second that. Only been here for a few weeks. Not trading yet, but feeling like this is the best investment I’ve made for a long time (09:50 am) Malcolm M: TWLO, 44min, up 20.25%, no sell signal yet… current trade is only 3 spot but up $1,121 (09:52 am) Lowell W: various JD and VLO calls GTC sold at options mkt open for +20% and +25%. Making one week’s target is a nice start to the day. (09:53 am) Malcolm M: TWLO: took 1/3 off, less than half an hour, $4.58, 24.83%, continue to hold 2 contracts. Stop moved to BE. (09:57 am) Aaron the red baron: Sold my two positions in AMD one for 83%, the other for 50%…..I’m outta here, that will do for the week (09:57 am) Claude Langley: out remainder AMD + 50% (09:58 am) Doug Campbell: Closing JD for 55% (10:02 am) Lowell W: Just closed a FB $140 call… made a 100%’er, may have been my first one. Today is over 3x my week’s goal. (10:06 am) Aaron the red baron: took 25% out of JD
(10:07 am) Malcolm M: 10% today in VIPS, 16% SQ, 6.7% ROKU, 23.5% AMD, 16% NVDA, 27% in TWLO… its a Very good day but I haven’t had my second cuppa yet! Not seeing any sell signals in /ES or /NQ (10:23 am) jerry g: took 58% on GLD calls (10:23 am) Elizabeth Lamond: sold Roku 23% done for the week too scary up there (10:23 am) Bill M.: Sold my GE for 87% (10:25 am) Linda J: Out of GE at 86%. (10:26 am) Rick Saddler: Closed GE 69% (10:41 am) Flash .: Sold some SQ @ 6% (10:47 am) Craig Kleinbart: just took some profits on FNGU
(10:48 am) Malcolm M: SQ, taking profits. $2.69, 31.64%, one contract, still holding majority. (10:51 am) Flash .: Malcolm, just call me chicken (10:53 am) Flash .: JNJ 14% (11:24 am) Rick Saddler: Closed AMD 50.68%
DISCLAIMER: Investing/ Trading involves significant financial risk and is not suitable for everyone. No communication from us should be considered as financial or trading advice. All information provided by it and Run Candlesticks Inc, its affiliates or representatives is intended for educational purposes only. You are advised to test any new approach before implementing it. Past performance does not guarantee future results. Terms of Service