Effectively Using Brokerage Orders
In this video, Doug Campbell discusses how to use different types of Brokerage order effectively, in order to make your life easier as a Trader. Numerous charts and trades are reviewed and used as current examples.
1 hour 28 minutes
Candlesticks • Price Action • T-Line • T-Line Bands • Support • Resistance • Trend • Trendlines • Chart Patterns • Buy Box • Volatility Stops • Profit Zones • Entry Zones • Protective Stops • RBB Rounded Bottom Breakout Strategy • Pop Out of The Box Strategy • Pinball Strategy • Trade Planning, Fibonacci, Stoch/RSI
[video_player type=”embed” style=”1″ dimensions=”custom” width=”640″ height=”480″ align=”center” margin_top=”0″ margin_bottom=”20″ ipad_color=”black”] [/video_player]
Investing and Trading involve significant financial risk and are not suitable for everyone. No communication from Hit and Run Candlesticks or it’s associates should be considered as financial or trading advice. All information is intended for Educational Purposes Only. Terms of Service
[testimonials style=”8″ margin_top=”” margin_bottom=””][testimonial name=”Alan%20Helmstetter” company=”” href=””]%3Cp%3EI’ve%20been%20managing%20my%20own%20money%20for%20many%20years%20and%20have%20been%20interested%20and%20dabbled%20in%20trading%20stocks.%20I%20joined%20some%20services%20over%20the%20years%2C%20but%20none%20worked%20for%20me.%20I%20am%20getting%20closer%20to%20retirement%20and%20wanted%20to%20learn%20more%20about%20trading%20stocks%20as%20something%20to%20do%20in%20retirement%20and%20to%20supplement%20income.%20I%20learned%20all%20about%20candlesticks.%20Did%20much%20paper%20trading%20of%20stocks.%20Results%20were%20good%2Fbad%20and%20never%20got%20ahead.%20Came%20across%20a%20free%20HRC%20webinar%20and%20really%20liked%20the%20approach.%20Joined%20a%20month%20trial%20and%20also%20attended%20an%20RWO%20webinar.%20Decided%20to%20join%20RWO%20because%20of%20the%20options%20approach%20and%20have%20been%20a%20member%20for%20four%20months.%20Rick%20and%20Doug%20are%20the%20real%20deal.%20Both%20are%20amazing%20at%20reading%20charts%2Fprice%20as%20well%20as%20teaching%20their%20expertise.%20In%20the%20daily%20chatroom%20you%20will%20get%20potential%20trades%2C%20but%20more%20importantly%2C%20you%20will%20become%20part%20of%20a%20team%2C%20learn%20how%20to%20identify%20trades%20and%20even%20more%20importantly%20how%20to%20properly%20plan%20and%20manage%20trades.%20You%20know%20the%20adage%20–%20%22You%20give%20a%20man%20a%20fish%2C%20and%20you%20feed%20him%20for%20a%20day.%20You%20teach%20him%20to%20fish%2C%20and%20you%20give%20him%20an%20occupation%20that%20will%20feed%20him%20for%20a%20lifetime.%22%20%3Cstrong%3EGive%20them%20a%20try%20you%20will%20not%20regret%20it!%3C%2Fstrong%3E%3C%2Fp%3E%0A
[/testimonial][/testimonials]
How I Plan to Trade BAC, JPM, C and WFC
In this video, Rick Saddler discusses the overall market and then focuses in on how he will be trading the big bank stocks. Later he answers questions and reviews audience tickers.
1 hour 14 minutes
Candlesticks • Price Action • T-Line • T-Line Bands • Support • Resistance • Trend • Trendlines • Chart Patterns • Buy Box • Volatility Stops • Profit Zones • Entry Zones • Protective Stops • RBB Rounded Bottom Breakout Strategy • Pop Out of The Box Strategy • Pinball Strategy • Trade Planning, Fibonacci, Stoch/RSI
[video_player type=”embed” style=”1″ dimensions=”custom” width=”640″ height=”480″ align=”center” margin_top=”0″ margin_bottom=”20″ ipad_color=”black”][/video_player]
Investing and Trading involve significant financial risk and are not suitable for everyone. No communication from Hit and Run Candlesticks or it’s associates should be considered as financial or trading advice. All information is intended for Educational Purposes Only. Terms of Service
[testimonials style=”8″ margin_top=”” margin_bottom=””][testimonial name=”Alan%20Helmstetter” company=”” href=””]%3Cp%3EI’ve%20been%20managing%20my%20own%20money%20for%20many%20years%20and%20have%20been%20interested%20and%20dabbled%20in%20trading%20stocks.%20I%20joined%20some%20services%20over%20the%20years%2C%20but%20none%20worked%20for%20me.%20I%20am%20getting%20closer%20to%20retirement%20and%20wanted%20to%20learn%20more%20about%20trading%20stocks%20as%20something%20to%20do%20in%20retirement%20and%20to%20supplement%20income.%20I%20learned%20all%20about%20candlesticks.%20Did%20much%20paper%20trading%20of%20stocks.%20Results%20were%20good%2Fbad%20and%20never%20got%20ahead.%20Came%20across%20a%20free%20HRC%20webinar%20and%20really%20liked%20the%20approach.%20Joined%20a%20month%20trial%20and%20also%20attended%20an%20RWO%20webinar.%20Decided%20to%20join%20RWO%20because%20of%20the%20options%20approach%20and%20have%20been%20a%20member%20for%20four%20months.%20Rick%20and%20Doug%20are%20the%20real%20deal.%20Both%20are%20amazing%20at%20reading%20charts%2Fprice%20as%20well%20as%20teaching%20their%20expertise.%20In%20the%20daily%20chatroom%20you%20will%20get%20potential%20trades%2C%20but%20more%20importantly%2C%20you%20will%20become%20part%20of%20a%20team%2C%20learn%20how%20to%20identify%20trades%20and%20even%20more%20importantly%20how%20to%20properly%20plan%20and%20manage%20trades.%20You%20know%20the%20adage%20–%20%22You%20give%20a%20man%20a%20fish%2C%20and%20you%20feed%20him%20for%20a%20day.%20You%20teach%20him%20to%20fish%2C%20and%20you%20give%20him%20an%20occupation%20that%20will%20feed%20him%20for%20a%20lifetime.%22%20%3Cstrong%3EGive%20them%20a%20try%20you%20will%20not%20regret%20it!%3C%2Fstrong%3E%3C%2Fp%3E%0A
[/testimonial][/testimonials]
How to Dissect and Trade a Naked Chart
In this video, Doug Campbell discusses how to interpret and trade a “naked” chart. The video covers topics ranging from Trend, Support and Resistance, being Patient and various tools you can use to help your trading. Numerous charts are reviewed as current examples.
1 hour 38 minutes
Candlesticks • Price Action • T-Line • T-Line Bands • Support • Resistance • Trend • Trendlines • Chart Patterns • Buy Box • Volatility Stops • Profit Zones • Entry Zones • Protective Stops • RBB Rounded Bottom Breakout Strategy • Pop Out of The Box Strategy • Pinball Strategy • Trade Planning, Fibonacci, Stoch/RSI
[video_player type=”embed” style=”1″ dimensions=”custom” width=”640″ height=”480″ align=”center” margin_top=”0″ margin_bottom=”20″ ipad_color=”black”][/video_player]
Investing and Trading involve significant financial risk and are not suitable for everyone. No communication from Hit and Run Candlesticks or it’s associates should be considered as financial or trading advice. All information is intended for Educational Purposes Only. Terms of Service
[testimonials style=”8″ margin_top=”” margin_bottom=””][testimonial name=”Alan%20Helmstetter” company=”” href=””]%3Cp%3EI’ve%20been%20managing%20my%20own%20money%20for%20many%20years%20and%20have%20been%20interested%20and%20dabbled%20in%20trading%20stocks.%20I%20joined%20some%20services%20over%20the%20years%2C%20but%20none%20worked%20for%20me.%20I%20am%20getting%20closer%20to%20retirement%20and%20wanted%20to%20learn%20more%20about%20trading%20stocks%20as%20something%20to%20do%20in%20retirement%20and%20to%20supplement%20income.%20I%20learned%20all%20about%20candlesticks.%20Did%20much%20paper%20trading%20of%20stocks.%20Results%20were%20good%2Fbad%20and%20never%20got%20ahead.%20Came%20across%20a%20free%20HRC%20webinar%20and%20really%20liked%20the%20approach.%20Joined%20a%20month%20trial%20and%20also%20attended%20an%20RWO%20webinar.%20Decided%20to%20join%20RWO%20because%20of%20the%20options%20approach%20and%20have%20been%20a%20member%20for%20four%20months.%20Rick%20and%20Doug%20are%20the%20real%20deal.%20Both%20are%20amazing%20at%20reading%20charts%2Fprice%20as%20well%20as%20teaching%20their%20expertise.%20In%20the%20daily%20chatroom%20you%20will%20get%20potential%20trades%2C%20but%20more%20importantly%2C%20you%20will%20become%20part%20of%20a%20team%2C%20learn%20how%20to%20identify%20trades%20and%20even%20more%20importantly%20how%20to%20properly%20plan%20and%20manage%20trades.%20You%20know%20the%20adage%20–%20%22You%20give%20a%20man%20a%20fish%2C%20and%20you%20feed%20him%20for%20a%20day.%20You%20teach%20him%20to%20fish%2C%20and%20you%20give%20him%20an%20occupation%20that%20will%20feed%20him%20for%20a%20lifetime.%22%20%3Cstrong%3EGive%20them%20a%20try%20you%20will%20not%20regret%20it!%3C%2Fstrong%3E%3C%2Fp%3E%0A
[/testimonial][/testimonials]
Trading with Discipline
 In this video, Doug Campbell discusses trading with discipline. The video covers topics ranging from Trend, Support and Resistance, being Patient and various tools you can use to help your trading. Numerous charts are reviewed as current examples.
1 hour 29 minutes
Candlesticks • Price Action • T-Line • T-Line Bands • Support • Resistance • Trend • Trendlines • Chart Patterns • Buy Box • Volatility Stops • Profit Zones • Entry Zones • Protective Stops • RBB Rounded Bottom Breakout Strategy • Pop Out of The Box Strategy • Pinball Strategy • Trade Planning, Fibonacci, Stoch/RSI
[video_player type=”embed” style=”1″ dimensions=”custom” width=”640″ height=”480″ align=”center” margin_top=”0″ margin_bottom=”20″ ipad_color=”black”][/video_player]
Investing and Trading involve significant financial risk and are not suitable for everyone. No communication from Hit and Run Candlesticks or it’s associates should be considered as financial or trading advice. All information is intended for Educational Purposes Only. Terms of Service
Trading Basics: Price Action, Trend, Support/Resistance
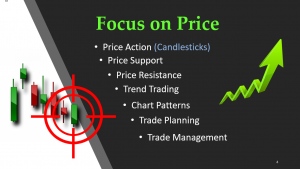
 In this video, Doug Campbell discusses the basics of trading…keeping it simple! Specifically, he reviews Price Action, Trend, Support and Resistance using dozens of charts to help layout potential trade setups.
1 hour 24 minutes
Candlesticks • Price Action • T-Line • T-Line Bands • Support • Resistance • Trend • Trendlines • Chart Patterns • Buy Box • Volatility Stops • Profit Zones • Entry Zones • Protective Stops • RBB Rounded Bottom Breakout Strategy • Pop Out of The Box Strategy • Pinball Strategy • Trade Planning, Fibonacci, Stoch/RSI
[video_player type=”embed” style=”1″ dimensions=”custom” width=”640″ height=”480″ align=”center” margin_top=”0″ margin_bottom=”20″ ipad_color=”black”][/video_player]
Investing and Trading involve significant financial risk and are not suitable for everyone. No communication from Hit and Run Candlesticks or it’s associates should be considered as financial or trading advice. All information is intended for Educational Purposes Only. Terms of Service
Public e-Learning June 12, 2018

In this video, Rick Saddler reviews his actual 2018 Road to Wealth Account Performance. He also covers the current performance of the Trader Vision Featured Trade Idea blog. After that, he answers questions, reviews the markets and analyzes the chart for a few dozen tickers that attendees asked about.
1 hour 39 minutes
Candlesticks • Price Action • T-Line • T-Line Bands • Support • Resistance • Trend • Trendlines • Chart Patterns • Buy Box • Volatility Stops • Profit Zones • Entry Zones • Protective Stops • RBB Rounded Bottom Breakout Strategy • Pop Out of The Box Strategy • Pinball Strategy • Trade Planning, Fibonacci, Stoch/RSI
[video_player type=”embed” style=”1″ dimensions=”custom” width=”640″ height=”480″ align=”center” margin_top=”0″ margin_bottom=”20″ ipad_color=”black”][/video_player]
Investing and Trading involve significant financial risk and are not suitable for everyone. No communication from Hit and Run Candlesticks or it’s associates should be considered as financial or trading advice. All information is intended for Educational Purposes Only. Terms of Service
Member e-Learning June 5, 2018

Member e-Learning from June 5, 2018. In this session, Doug Campbell covered Trading Psychology, the Psychology behind Price Action and treating trading like a business.
Candlesticks • Price Action • T-Line • T-Line Bands • Support • Resistance • Trend • Trendlines • Chart Patterns • Buy Box • Volatility Stops • Profit Zones • Entry Zones • Protective Stops • RBB Rounded Bottom Breakout Strategy • Pop Out of The Box Strategy • Pinball Strategy • Trade Planning, Fibonacci, Stoch/RSI
[video_player type=”embed” style=”1″ dimensions=”custom” width=”640″ height=”480″ align=”center” margin_top=”0″ margin_bottom=”20″ ipad_color=”black”][/video_player]
Investing and Trading involves significant financial risk and is not suitable for everyone. No communication from Hit and Run Candlesticks or it’s associates should be considered as financial or trading advice. All information is intended for Educational Purposes Only. Terms of Service
Public e-Learning April 24, 2018
Candlesticks • Price Action • T-Line • T-Line Bands • Support • Resistance • Trend • Trendlines • Chart Patterns • Buy Box • Volatility Stops • Profit Zones • Entry Zones • Protective Stops • RBB Rounded Bottom Breakout Strategy • Pop Out of The Box Strategy • Pinball Strategy • Trade Planning, Fibonacci, Stoch/RSI
[testimonials style=”8″ margin_top=”” margin_bottom=””][testimonial name=”Alan%20Helmstetter” company=”” href=””]%3Cp%3EI’ve%20been%20managing%20my%20own%20money%20for%20many%20years%20and%20have%20been%20interested%20and%20dabbled%20in%20trading%20stocks.%20I%20joined%20some%20services%20over%20the%20years%2C%20but%20none%20worked%20for%20me.%20I%20am%20getting%20closer%20to%20retirement%20and%20wanted%20to%20learn%20more%20about%20trading%20stocks%20as%20something%20to%20do%20in%20retirement%20and%20to%20supplement%20income.%20I%20learned%20all%20about%20candlesticks.%20Did%20much%20paper%20trading%20of%20stocks.%20Results%20were%20good%2Fbad%20and%20never%20got%20ahead.%20Came%20across%20a%20free%20HRC%20webinar%20and%20really%20liked%20the%20approach.%20Joined%20a%20month%20trial%20and%20also%20attended%20an%20RWO%20webinar.%20Decided%20to%20join%20RWO%20because%20of%20the%20options%20approach%20and%20have%20been%20a%20member%20for%20four%20months.%20Rick%20and%20Doug%20are%20the%20real%20deal.%20Both%20are%20amazing%20at%20reading%20charts%2Fprice%20as%20well%20as%20teaching%20their%20expertise.%20In%20the%20daily%20chatroom%20you%20will%20get%20potential%20trades%2C%20but%20more%20importantly%2C%20you%20will%20become%20part%20of%20a%20team%2C%20learn%20how%20to%20identify%20trades%20and%20even%20more%20importantly%20how%20to%20properly%20plan%20and%20manage%20trades.%20You%20know%20the%20adage%20–%20%22You%20give%20a%20man%20a%20fish%2C%20and%20you%20feed%20him%20for%20a%20day.%20You%20teach%20him%20to%20fish%2C%20and%20you%20give%20him%20an%20occupation%20that%20will%20feed%20him%20for%20a%20lifetime.%22%20%3Cstrong%3EGive%20them%20a%20try%20you%20will%20not%20regret%20it!%3C%2Fstrong%3E%3C%2Fp%3E%0A
[/testimonial][/testimonials]
[video_player type=”embed” style=”1″ dimensions=”640×360″ width=”640″ height=”360″ align=”center” margin_top=”0″ margin_bottom=”20″ ipad_color=”black”][/video_player]
Candlesticks • Price Action T-Line • T-Line Bands • Support • Resistance • Trendlines • Chart Patterns • Buy Box • Volatility Stops • Profit Zones • Entry Zones • Protective Stops • RBB Rounded Bottom Breakout Strategy • Pop Out of The Box Strategy • Pinball Strategy • Continuation Patterns • Trade Planning
[button_1 text=”Coaching%20With%20Rick%20Saddler” text_size=”32″ text_color=”#000000″ text_bold=”Y” text_letter_spacing=”0″ subtext_panel=”Y” subtext=”Learn%20More%20%E2%80%A2%20Click” subtext_size=”20″ subtext_color=”#d00606″ subtext_bold=”Y” subtext_underline=”Y” subtext_letter_spacing=”0″ text_shadow_panel=”N” styling_width=”40″ styling_height=”30″ styling_border_color=”#000000″ styling_border_size=”1″ styling_border_radius=”6″ styling_border_opacity=”100″ styling_gradient_start_color=”#ffff00″ styling_gradient_end_color=”#ffff00″ drop_shadow_panel=”N” inset_shadow_panel=”N” align=”center” href=”https://hitandruncandlesticks.com/swing-trade-coaching-with-rick-saddler-founder-of-hit-and-run-candlesticks/” new_window=”Y”/]
Hit and Run Candlesticks Events Calendar – Click Here
Trading Inside Days
November 14 • 2017
In this webinar, Rick Shares one of his most powerful strategies, “Trading Inside Days.” Trading inside days when a chart is properly set up can be very rewarding. With 30 years in the trading business, it is a must you learn the trading technique for success.
[video_player type=”embed” width=”560″ height=”315″ align=”center” margin_top=”0″ margin_bottom=”20″][/video_player]
[button_2 color=”blue” align=”center” href=”https://hitandruncandlesticks.com/hrc-rwo-30-day-offer/” new_window=”Y”]Try Us Out For 30-Days • Boost Your Profits • Learn Strategies The Work[/button_2]