The market faces a weekend of uncertainty.
The market faces a weekend of uncertainty.
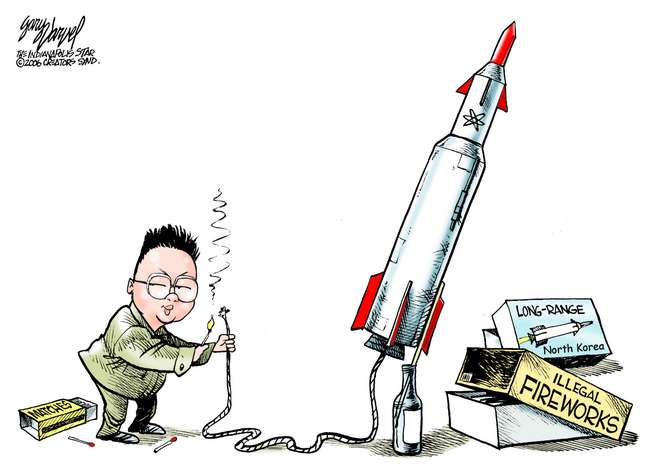 A mad man who believes he is a god with the power of nuclear weapons at his disposal and the temperament of a misguided teenager. What could go wrong with that? Obviously, the market faces a weekend of uncertainty as the UN gathers for an emergency meeting to discuss the escalation of threat. The futures reacted lower after the launch of the missile but had recovered overnight. I wonder if they will be able to hold the market up all day? I have to assume many will be looking to reduce their exposure ahead of the weekend. The volatility of this market is very difficult to trade. Please have a plan to protect your capital.
On the Calendar
A busy Friday Economic Calendar begins with the very important Retail Sales report at 8:30 AM Eastern. The expectation is for an increase of only 0.1 vs. 0.6 due to Hurricane Harvey impacts. Also at 8:30 AM we get the latest reading on the Empire State Mfg Survey which is expected to decline to 19.0 vs. 25.2 last month. Industrial Production at 9:15 AM is another very important number which is expected to lift by 0.1% vs. a decline last month. Then at 10:00 AM we get Business Inventories and Consumer Sentiment. Forecasters see an increase in Inventories of 0.2% and a slight decline in Sentiment to 96.0 vs. 96.8 last reading.
There are only nine companies reporting earning on the Calendar today. Also worth noting is that both the DIA and SPY pay quarterly dividends today which can have a slight impact on their prices.
Action Plan
In the act of defiance, North Korea fired another missile over the head of Japan. This one went considerably higher and farther than previous launches. Yesterday test proved they now can strike Guam once again raising the stakes in this very dangerous game. South Korea responded with their own missile launch and running military drills near the border also escalating tensions. The futures began to quickly drop but have bounced back to a flat reading this morning.
Now my question is will the market hold up as we head into a weekend filled with uncertainty? As for me, I will be laser focused on price action and prepared to take action on any hints of failure. Taking on new risk ahead of this weekend is not impossible but very unlikely due to the current circumstances. I will not hesitate to capture gains if I see clues of the selloff and I may even look to take some gains simply to reduce my risk ahead of the weekend. We are dealing with a very unstable North Korean leader which makes him very dangerous and unpredictable. Of course, that does not mix well with markets.
[button_2 color=”green” align=”center” href=”https://youtu.be/2OogdLIhmF4″]Morning Market Prep Video[/button_2]Trade Wisely,
Doug