
SPXU – Doji Continuation Pattern
 SPXU – Closed Friday with a Doji Continuation Pattern, we have found this pattern to be very successful when you add other conditions with it. Such as a breakout of the downtrend line, bottoming patterns like a double bottom or a higher low. 2 or 3-day charts with a Bullish Engulfs. And SPXU is now one of our Rounded Bottom Breakout patterns/strategies. Keep in mind most charts don’t work right away unless you only want 1,2,3% gains and I have never met anyone who makes a living on 1,2,3% We want to profit more…don’t you?
Good Trading – Hit and Run Candlesticks
Learn more about Hit and Run Candlesticks, and today’s trade idea and plan plus the 10 or more members trade ideas, starting at 9:10 EST AM every morning. Every day we teach and trade using the T-Line, Candlesticks, Support and Resistance, Trends, chart patterns and continuation patterns.
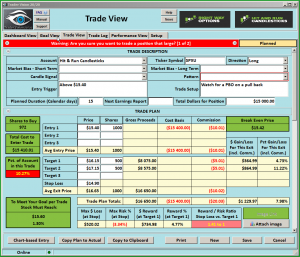
Trade Updates – Hit and Run Candlesticks
A good trader knows when to back down, lighten up on position, except the fact some days you are better off not to trade, did you know you don’t have to trade everyday? A good trader knows a $100.00 loss can be good – especially when you finally take the loss and now it’s a $500.00 loss. We are proudly in only 3 positions and in NO HURRY to trade until this craziness has stopped. Plan your trading strategy to win!
Are you having trouble putting together a winning trade? Not sure what scans to use? So near to having multiple winning trades, but something always goes wrong. Maybe a couple hours with a trading coach could make all the difference in the world. Hit and Run Candlesticks has 4 trading coaches – Learn More about the Coaches
With on-demand recorded webinars, eBooks, and videos, member and non-member eLearning, plus the Live Trading Rooms, there is no end your trading education here at the Hit and Run Candlesticks, Right Way Options, Strategic Swing Trade Service and Trader Vision.
► KITE – You would be up 23.48% or $2475.00
If you bought 100 shares when we posted to our members on July 20. Hit and Run Candlesticks members practice trade management and trade planning with Price and Candlesticks, The T-line, Trend, Trend Lines, Chart Patterns, Support, and Resistance.
► Eyes On The Market (SPY) Warning
The SPY has broken below the support line holding the lows together and has formed a Bearish “h” pattern. With Fridays close, we have a lower high and a lower low and a Bearish Doji Continuation pattern setup. When you add the short-term oversold, we could see a relief bounce. We see both long and short trade with a ton of chop, keep your fingers away from the blade.
► What is a Trade Idea Watch-list?
A trade idea watchlist is a list of stocks that we feel will move in our desired direction over a swing trader’s time frame. That time could be one to 15 days for example. From that watch list, we wait until price action meets our conditions for a trade.
Rick’s personal trade ideas for the day MEMBERS ONLY
Start your education with wealth and the rewards of a Swing Traders Life – Click Here
Investing and Trading involve significant financial risk and are not suitable for everyone. No communication from Hit and Run Candlesticks Inc. is financial or trading advice. All information is intended for Educational Purposes Only. Terms of Service.
Rick Saddler is not a licensed financial adviser nor does he offer trade recommendations or advice to anyone except for the trading desk of Hit and Run Candlesticks Inc.


Comments are closed.