Risk of the G20
 Unable to follow through on Wednesday’s momentum traders face some difficult decisions as we head into the weekend and the outcome risk of the G20 meeting. Will the US and China kiss and makeup or will the tensions between the only increase when the tow very stubborn leaders meet? Unfortunately, the answer to that question will happen over the weekend. Will you accept the additional risk of holding into the weekend or will you choose close positions to avoid the unknown?
If you look at the index charts from a technical perspective, they are at a critical point of decision. Can they break through the downtrend resistance or will they fail, creating yet another higher low an increasing the technical damage. A tough call for sure and the fact that futures are pointing to a triple point gap down this morning does not make that decision any easier! No matter what you decide to go into the weekend with your eye’s wide open about the potential risks or rewards depending on the outcome of the G20 meeting.
On the Calendar
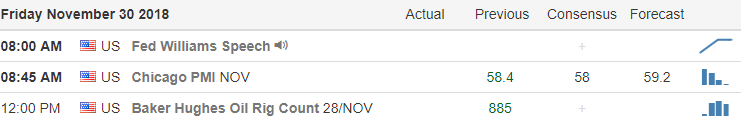
On the Earnings Calendar, we have only 17 companies reporting as we slide into the weekend.
Action Plan
For a brief time yesterday, it looked as if the momentum of Wednesday would win the day but sadly heading into the close indexes slipped back into the red. Now the will market look to the G20 meeting for inspiration, but unfortunately, the outcome of that meeting will occur of the weekend. This morning futures are suggesting a triple point gap down amid swirling speculation of the possible outcome. The question for today is will we see follow-through selling after the open with traders avoiding the weekend risk or will volume simply dry up as we wait?
Technically speaking even after the big Wednesday rally the indexes are still in a downtrend. A failure at or near the downtrend could create more technical damage and raise concerns of yet another test of the lows. Keep an on the VIX for clues of fear creeping back in the mind of the market. Honestly, I hope cooler heads prevail, and we simply slide quietly into the weekend as we wait. However, putting our head in the sand an not preparing for all possibilities is irresponsible. Stay focused on the price action after the morning rush for clues and consider the risk carefully as we head into the weekend.
Trade Wisely,
Doug
[button_2 color=”green” align=”center” href=”https://youtu.be/Thk5-3hBvTw”]Morning Market Prep Video[/button_2]
Crumbs from Relief Rallies
Crumbs from relief rallies are when the trend is down, and traders take advantage of short-term rallies into resistance or the bearish downtrend line. The SPY ended yesterday with a Doji, and when you place it next to the previous day, you have a Doji Continuation patt5ern. Of course for the pattern to work, we must have followed through. Price action above $274.60 would be a step in the right direction, ultimately price action over $280.60 would set the SPY up for a challenge of the October highs. Price action failing the $274.60 area could lead to a retest of about $268.45 or even lower. Please note the trend is still the seller’s friend and buyers are picking up crumbs from the relief rallies.

On Track This Year 362%
One of the most important tools Rick uses to achieve trading success in a Real-Time Live Scanner. To up your game and achieve higher profits consider the LTA – Live Trading Alert Scanner Traspaerancey and Trading Results.
DISCLAIMER: Investing / Trading involves significant financial risk and is not suitable for everyone. No communication from us should be considered as financial or trading advice. All information provided by Hit and Run Candlesticks Inc, its affiliates or representatives is intended for educational purposes only. You are advised to test any new approach before implementing it. Past performance does not guarantee future results. Terms of Service
Less Aggressive FOMC
 Did anyone notice a sparkle in Jerome Powell’s eye and check for reindeer on the roof as he delivered the huge gift of a less aggressive FOMC? Moments, after he began to speak the gates opened and the bulls unleashed a huge wave of buying that quickly cut through pesky price resistance levels. Currently, the US Futures are pointing to a modest gap down open this morning, but a little profit-taking after such a huge one-day bull run should not be a big surprise.
Keep a close eye on the price action because the sheer momentum of yesterday’s move could inspire the bulls to continue pushing forward into the weekend. Now the market will focus it’s attention on the G20 meeting and hoping it will help deliver the bigger gift; progress on the US / China trade negotiations. With the harsh rhetoric and threats lobed back an forth between the two leaders that might be a big ask. Stay focused on price action the clues will be there.
On the Calendar
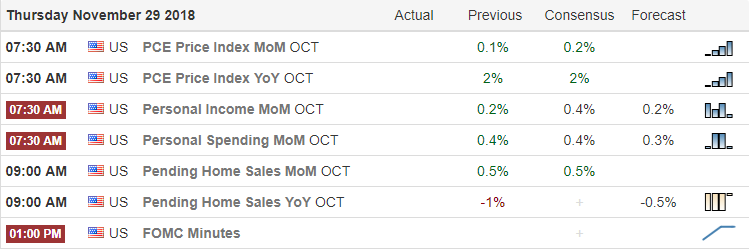
On the Earnings Calendar, we have our biggest day of the week with 54 companies expected the report to keep us on our toes.
Action Plan
The Fed Chairman Jerome Powell triggered a bullish stampede yesterday indicating a less aggressive
FOMC than the market had expected. The burst of buying cut through resistance levels in the indexes as if a pressure value suddenly opened. After such a huge move its not unreasonable to think there will be some profit taking and according to this morning’s futures we should see a modest gap down.
If we could now get a trade agreement between the US and China, Santa’s could come to town in a newly turbocharged sleigh! Unfortunately, it’s not all sunshine and roses this morning with the news of a police raid on Deutsche Bank with allegations of money laundering. After the morning pullback, keep a close eye on the price action, yesterday’s huge momentum could keep the Bulls pushing forward into the end of the week.
Trade Wisely,
Doug
[button_2 color=”green” align=”center” href=”https://youtu.be/zjP0ZPa0XR8″]Morning Market Prep Video[/button_2]
G20 Trump China Up Next
G20 Trump and China up next, if they can ease the tension like Powell did yesterday Santa could be back in town. Of course, it may be coal for us if the kids don’t play nice. Yesterday we saw a huge move in the market, DJ-30 up over 600 points! The SPY has seen nothing but three days of bullishness with yesterday being the big winner. Price has nearly come back to challenge the 200- and 50-SMA’s and the close yesterday was above the 50% line from the recent high to the recent low. We should expect a little rest and inside action today and possibly a challenge of the 200-SMA before the weekend. Looking forward to pulling a few profits off the next two days.
Live Trading Alert Hot List
CYH recently was a Rounded Botmm Breakout set up and now has broken out above the 200-SMA on good volume. The 20-day chart pattern is a near perfect J-Hook Continuation pattern. With yesterdays close above $4.00 CYH may be getting ready for the next level. Add CYH to LTA-Live Trading Alerts Real Time Market Scanner watchlist for a buying alert. CYH bullish above $3.90, stop below $3.79
Members, please log in to the member’s blog for more Trade-Ideas. Start here for membership or a trial
****VXX – Bring the VXX down, bring the fear down
Trading Services We Offer
- Hit and Run Candlesticks
- Right Way Options
- Top Gun Day Trading
- 30-Day Trial
362% On Track This Year
Rick uses three main trading tools and has dialed them in for max performance. Rick also freely shares his insights on what makes the tools the best and how to use them. Rick is also one of the only traders in the industry that shares his trading account. Traspaerancey and Trading Results.
- LTA – Live Trading Alerts Get your 30-Day Trail
- TC2000 Charting Get $25.00 Off
- TradeHawk Trading Platform
Free YouTube Education • Subscription Plans • Private 2-Hour Coaching
YouTube Videos
Trading at the Beach • How to set up the T-Line Regression Lines • MetaStock Automated • Trading the T-Line Trap • Shorting the Blue Ice Pattern
DISCLAIMER: Investing / Trading involves significant financial risk and is not suitable for everyone. No communication from us should be considered as financial or trading advice. All information provided by Hit and Run Candlesticks Inc, its affiliates or representatives is intended for educational purposes only. You are advised to test any new approach before implementing it. Past performance does not guarantee future results. Terms of Service
Developing and Maintaining a Trading
Edge to Improve Your Win/Loss Ratio
In this video, Doug Campbell talks about Developing and maintaining a Trading Edge to improve your Win/Loss Ratio. He discusses how professional stock and option traders develop a trading edge. Improving your Win/Loss Ratio requires a consistent process and set of rules to protect you from you biggest trading enemy. You! As a stock trader and option trader you’re in competition with all other traders that are trying to take your hard-earned money away from you.
Trading without an edge reduces your odds of success and your win/loss ratio will suffer as a result. Maintaining a trading edge requires a disciplined and relentless pursuit of consistency to reach your goals and grow your account. Start to develop your trading edge today.
1 hour 20 minutes
[video_player type=”youtube” style=”1″ dimensions=”640×360″ width=”640″ height=”360″ align=”center” margin_top=”0″ margin_bottom=”20″ ipad_color=”black”]aHR0cHM6Ly95b3V0dS5iZS8xS0drWWN1dzZmRQ==[/video_player]
Candlesticks • Price Action • T-Line • T-Line Bands • Support • Resistance • Trend • Trendlines • Chart Patterns • Buy Box • Volatility Stops • Profit Zones • Entry Zones • Protective Stops • RBB Rounded Bottom Breakout Strategy • Pop Out of The Box Strategy • Pinball Strategy • Trade Planning, Fibonacci, Stoch/RSI
Investing and Trading involve significant financial risk and are not suitable for everyone. No communication from Hit and Run Candlesticks or it’s associates should be considered as financial or trading advice. All information is intended for Educational Purposes Only. Terms of Service
Relief Rally?
 Although volume remained light a relief rally is still a welcome site! The bulls found the energy to not only defend the support of yesterdays gap down but also push the Dow into the November 20th gap. A good start but let’s keep in mind that with so much technical damage and the threat of increasing tariffs just around the corner the price action is likely to remain very challenging. The QQQ is only a couple days away from joining the IWM with a death cross, and the DIA still has the 200-day average as resistance.
Of course, a trade deal with China would be a game changer but now seem less and less likely as the rhetoric continues to fly between the two countries. Asian markets closed sharply higher overnight, and European markets are currently mostly higher as well. As a result, the US futures are pointing a gap up open of more than 100 points this morning. As nice as it is to see the bulls running, please remember to respect the overhead resistance. Chasing into the market on a gap up near price resistance levels is a dangerous business. It would be wise to wait and see if buyers step in to support the gap or if profit takers take the gift provided by the gap.
On the Calendar
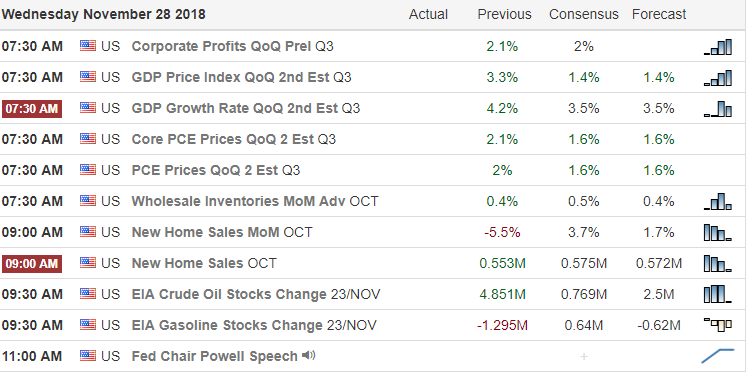
On the Earnings Calendar, we have just under 40 companies expected report so please continue to check new and existing positions as part of your daily preparation.
Action Plan
After a concerning gap down yesterday the bulls hung in there defending support moving the indexes higher even though volume remained quite low. The big gap down created on 11/20/18 now has a good chance of being filled and challenging the nest level of resistance. Unfortunately, the QQQ is only a couple days away from joining the IWM with a death cross. We should expect challenging price action and volatility to continue.
Even with the current relief rally, we must keep in mind that the overall markets are still in a downtrend. That means we have to be on the lookout for possible failures as we approach resistance levels. This morning the futures are pointing to a gap up open, and we all know that brings with it the possibility of the dreaded pop and drop pattern. If you’re already long, remember that gaps are gifts and consider taking some profits. However, if you’re looking to enter a new position, make sure there is follow-through buying supporting the gap.
Trade Wisely,
Doug
[button_2 color=”green” align=”center” href=”https://youtu.be/lDCJ8sysDxE”]Morning Market Prep Video[/button_2]


