In this video, Doug Campbell talks about the merits of Position Trading and the great profits that can be achieved. Position trading is a trading style with longer holds times then swing trading yet much shorter than by and hold investing.
Position trading requires less time then swing trading and is very well suited to those currently working full-time or unable to closely watch the market during the day. It requires only basic computer equipment and standard internet speeds to be successful yet can be an extremely profitable style of trading.
1 hour 30 minutes
Candlesticks • Price Action • T-Line • T-Line Bands • Support • Resistance • Trend • Trendlines • Chart Patterns • Buy Box • Volatility Stops • Profit Zones • Entry Zones • Protective Stops • RBB Rounded Bottom Breakout Strategy • Pop Out of The Box Strategy • Pinball Strategy • Trade Planning, Fibonacci, Stoch/RSI
Investing and Trading involve significant financial risk and are not suitable for everyone. No communication from Hit and Run Candlesticks or it’s associates should be considered as financial or trading advice. All information is intended for Educational Purposes Only. Terms of Service
Another pop and drop pattern as yesterday’s 350 point gap finds only sellers amid so much political uncertainty. This morning futures are once again pointing an overnight reversal and gap up open of more than 150 Dow points. The question is will there be buyers there or will it meet with another round of selling? Almost every day I hear from traders that get caught up in the morning hype chase into the morning gap and watch their account getting chopped to pieces.
The fear of missing out is a powerful emotion, and it will destroy a trading account! Stop chasing,focus on the price action with discipline and patience and avoid all the news-driven drama. If the market gaps up wait until you see buyers supporting the gap before entering trades. If gaps down wait for proof that the sellers will support the bearish gap will follow-through selling. Until there is some resolution to all this political uncertainty volatility is likely here to stay so get disciplined or wave goodbye to your money.
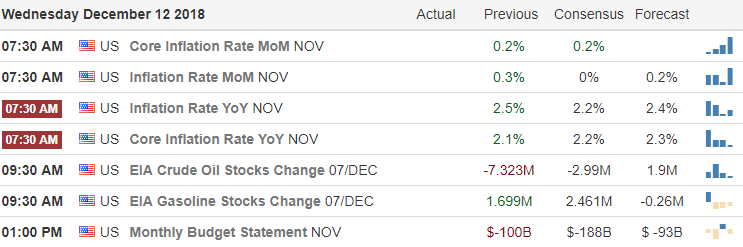
On the Calendar
On the Earnings Calendar,we have 22 companies ready to fess up to their quarterly results today. Make sure you’re checking those reporting against current holdings.
Action Plan
Once again wild volatility plagued the market yesterday with another nasty whipsaw gaping up sharply at the open but finding only sellers. A Whitehouse press conference between the President and Democratic partially fueled the selling shining a spotlight on the political uncertainty we face going forward. However, Asian markets shook the uncertainty rallying sharply across the board on the possible easing trade tensions between the US and China. Europe is also currently bullish across the board this morning even as the British Prime Minister faces a no-confidence vote today.
As a result, the US Futures are once again pointing to a triple point gap up of more than 175 points. Will, there be buyers there today, or will sellers produce another pop and drop pattern? Only time will tell, and the best we can do is stay focused on the price action with discipline and patience. We should expect volatility to continue and very challenging trading until we can get past at least some of the politically generated uncertainty.
The price action of the SPY closed below the T-Line, and the T-Line closed below the 34-EMA. Theinformation I just mentioned has been information I have used for years, and ithas served me well. Not only in the indices but trading charts as well. Thequestion now is how can you use that information.
Yesterday the SPY respected
the current bottom and Mondays Hammer candle; The morning futures are up at the
moment; maybe there is hope for the bull. BUT the trend in the SPY is still down,
for the buyers to get started they would have to close over the Morning Star
pattern, above $269.45
(CPB)Hammer/Morning Star Candles
Weare adding CPB to Live Scanner watchlist to be alerted when price action makes a 2-bar high. The 2-bar high will be the alert telling us when there is price action positive follow through. Positive price action may lead to a test of the200-SMA followed by the $40.65 test. Then we will have a weekly RBB set up. CPBwouldbe a 2-3-month option play. The market is a mess right now and may not bethe best market to trade for most traders, stay cautious.
LTA – Real-Time Stock Scanner
Rick uses three main trading tools and has dialed them in for max performance. Rick also freely shares his insights on what makes the tools the best and how to use them. Rick is also one of the only traders in the industry that shares his trading account.Traspaerancey and Trading Results.
DISCLAIMER: Investing/ Trading involves significant financial risk and is not suitable for everyone. No communication from us should be considered as financial or trading advice. All information provided by it and Run Candlesticks Inc, its affiliates or representatives is intended for educational purposes only. You are advised to test any new approach before implementing it. Past performance does not guarantee future results. Terms of Service
Extreme price volatility displayed emotions from gloom and doom to bullish euphoria which produced a whipsaw on steroids. The good news is with the futures pointing to a possible follow-through this morning a nice bottoming chart pattern is possible. The bad news is that very little has changed and the political uncertainty is likely to keep volatility high with challenging price action.
This morning’s open will be about 800 Dow points off of yesterday slow. If that, not the very definition of extreme volatility I don’t know what is! Don’t chase the morning with the fear of missing out. Wait to see if buyers step in to support the gap and remember a pop and drop is now out of the question. Plan your trades carefully and realize this wild price action will require a higher tolerance to risk.
On the Calendar
On the Earnings Calendar,we have 34 companies on reporting, but we drop off into the lower twenty ’s and teens as the 4th quarter winds down.
Action Plan
No doubt about it the wild ride continues with a massive whipsaw covering about 1000 Dow points from top to bottom and then bottom to top. Asian markets also had a very volatile night but closing mixed but mostly higher. In Europe, the Sterling continues to fall after delaying the Brexit vote, but currently, their markets are shaking that off and are bullish across the board this morning. US Futures went into the evening down also made a nice recovery overnight and are currently pointing to a gap up around 200 points.
That’s around 800 Dow points off of yesterday’s low so be care not to chase fearing you will miss out. Remember we want to make sure buyers will actually step in to support the gap after the open rather than profit-takers selling into strength an producing a pop and drop pattern. With the wild volatility it will be very difficult to find low risk entry positions so if you do trade keep in mind your tolerance to risk should must be carefully considered.
So the question todayis: Are we starting another relief rally? The answer is yes it would appear so.Yesterday the sellers pushed hard to, but the buyers pushed back a littleharder to draw a Hammer. The futures are feeling bullish this morning, and itlooks like the SPY will open higher. This week will be no time for the buyersto give up, the following key levels are what the buyers need to own: $269.95,$275.60, $281.05. Price reaching anyone of these numbers will be a relief rallywithin a downtrend, the sellers will be out like trick or treaters on Hollowee nnight looking for candy.
(FB)Bullish Piercing Candle
We bought FB yesterday as did a few subscribers in the trading room. We feel FB is bullish over $143.30. Facebook has drawn a Bullish (PBO) Pricing candle and proved to follow through yesterday. Price disclosed over the daily downtrend line and challenged the 60-min 200-SMA. Cautions we approach the 50-SMA. Trade-Ideas For The Watchlist: TC2000, TNDM, EXEL, FB, DATA, TWLO, CME, AMBA, SYMC, MRK, NWL, UAA
Real-Time Stock Scanner
Rick uses three main trading tools and has dialed them in for max performance. Rick also freely shares his insights on what makes the tools the best and how to use them. Rick is also one of the only traders in the industry that shares his trading account.Traspaerancey and Trading Results.
DISCLAIMER: Investing/ Trading involves significant financial risk and is not suitable for everyone. No communication from us should be considered as financial or trading advice. All information provided by it and Run Candlesticks Inc, its affiliates or representatives is intended for educational purposes only. You are advised to test any new approach before implementing it. Past performance does not guarantee future results. Terms of Service
So the question todayis: Are we starting another relief rally? The answer is yes it would appear so.Yesterday the sellers pushed hard to, but the buyers pushed back a littleharder to draw a Hammer. The futures are feeling bullish this morning, and itlooks like the SPY will open higher. This week will be no time for the buyersto give up, the following key levels are what the buyers need to own: $269.95,$275.60, $281.05. Price reaching anyone of these numbers will be a relief rallywithin a downtrend, the sellers will be out like trick or treaters on Hollowee nnight looking for candy.
(FB)Bullish Piercing Candle
Webought FB yesterday as did a few subscribers in the trading room. We feel FB isbullish over $143.30. Facebook has drawn a Bullish (PBO) Pricing candle and proved to follow through yesterday. Price didclose over the daily downtrend line and challenged the 60-min 200-SMA. Cautionas we approach the 50-SMA.
Real-Time Stock Scanner
Rick uses three main trading tools and has dialed them in for max performance. Rick also freely shares his insights on what makes the tools the best and how to use them. Rick is also one of the only traders in the industry that shares his trading account.Traspaerancey and Trading Results.
DISCLAIMER: Investing/ Trading involves significant financial risk and is not suitable for everyone. No communication from us should be considered as financial or trading advice. All information provided by it and Run Candlesticks Inc, its affiliates or representatives is intended for educational purposes only. You are advised to test any new approach before implementing it. Past performance does not guarantee future results. Terms of Service
The futures pointing to another gap down open the big question is will the bulls defend October/November price supports or will the bear’s seek a lower level. Asian and European markets fell overnight on disappointing trade data and global growth concerns. With so much political uncertainty weighing on the mind of the market we should expect volatility and challenging price action to continue for the near future.
As much as I would love to see the Bulls defend current supports, there is nothing in the current price action as of now suggesting that is the case. In fact, an unbiased look at the index charts shows us the possibility of more downside if the current support fails. If the Bulls do defend support, remember there is a lot of price resistance and technical damage above. With volatility so high anything is possible so if you do decide to trade be willing to take profits and cut losses quickly. Always remember that cash is a position and you do not have to trade every day to be a successful trader.
On the Calendar
On the Earnings Calendar,we have 36 companies reporting earnings today to keep traders on their toes. Continue the good practice of bouncing the earnings calendar against current holdings.
Action Plan
Futures opened yesterday afternoon and quickly fell 200 points but have slowly improved overnight. Asian markets closed sharply lower overnight on worse than expected trade data and European markets are lower this morning due to global growth worries. Consequently, the current US Futures markets are currently pointing to a modest gap down testing the strength of the November price supports but that could easily change as we near the open. If the November supports do fail then watch for DIA 240, SPY 260, QQQ 157, support levels to be tested.
With the VIX closing on Friday above a 25 handle fear could easily transition into to panic if sellers remain in control and November supports fail. As a result, we should expect volatile price action and higher option prices for the near future as political uncertainty continues to weigh on the market. If you’re currently short, watch price action carefully for potential bounces off of support as reasons to take profits. Also be careful not to chase short positions at or near price support levels. If you want to be a buyer, don’t try to predict or anticipate the bottom. That’s the job of the big institutions and keep in mind the bottom may still be lower. Wait for good price action signals before entering and prepare for volatility.
The price action on Friday struggled then held Thursdays low, and we now have a triple test bottom with the past four candles suggesting the sellers have control. With price action below the daily 50-SMA and weekly 200-SMA on top of the three failed highs, I would have to say the market is not looking so good. Short term relief rallies are normal just not likely to produce large bullish moves until price crosses levels. Three important key levels are $270.64, $277.25. 281.25.
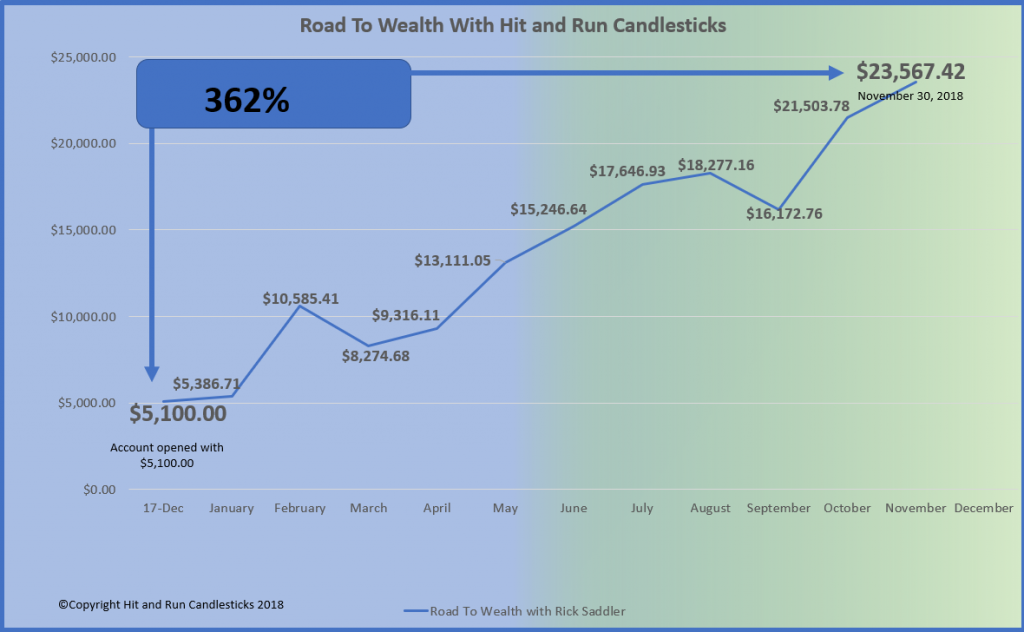
Friday I went to all-cash taking a pro-active stance on protecting the 362% we are up this year on the “Road To WealthAccount.” Going forward into the end of the year I will be trading like I am walking on thin lake ice. The game is to create wealth not pick lotterytickets. The “Road To Wealth” Brokerage Statement can be found by Clicking Here
Today’s Trade-Idea Thoughts
We have not increased our “Road To Wealth Account” simple by trading willy-nilly and don’t intend to start today. Today we will talk about trades in the trading room when we see the attitude of the market and not before.
362% November Statement
Rick uses three main trading tools and has dialed them in for max performance. Rick also freely shares his insights on what makes the tools the best and how to use them. Rick is also one of the only traders in the industry that shares his trading account.Traspaerancey and Trading Results.
DISCLAIMER: Investing/ Trading involves significant financial risk and is not suitable for everyone. No communication from us should be considered as financial or trading advice. All information provided by it and Run Candlesticks Inc, its affiliates or representatives is intended for educational purposes only. You are advised to test any new approach before implementing it. Past performance does not guarantee future results. Terms of Service
In this E-Learning call we dive into the Long Put Option Directional Strategy details. We also cover the trade setup and the chart patterns that produce high probability directional put positions.