A traders code for (Bullish trends), Higher highs and lower lows, and the opposite for (Bearish trends) Lower lows and Lower highs. The following charts have been following the bearish code. IYT, SMH, FDX, and COPX are a few charts I watch to get the pulse of the market. You can get the same picture by using three moving averages such as The 3-EMA, T-Line, and 34-EMA, another popular combo is the 3-EMA, T-Line, and17-EMA or simply three moving averages that make sense to that fit in your trading world. When you look at the above charts and the moving average groupings what do you see?
Hit and RunCandlesticks and Right Way Options have opened our doors forthe holidays; this would be a great time to get to know us, ask a question aboutour service and put a few $$$ in your pocket. Trading Rooms #1 and #2 no password required – https://hitandruncandlesticks.com/trading-rooms/
Watchlist Ideas
Becauseof technical issues, we will not have any trade ideas for the watchlist today.After the market open the LTA scanner will find up more we can trade. Thank you for your understanding.
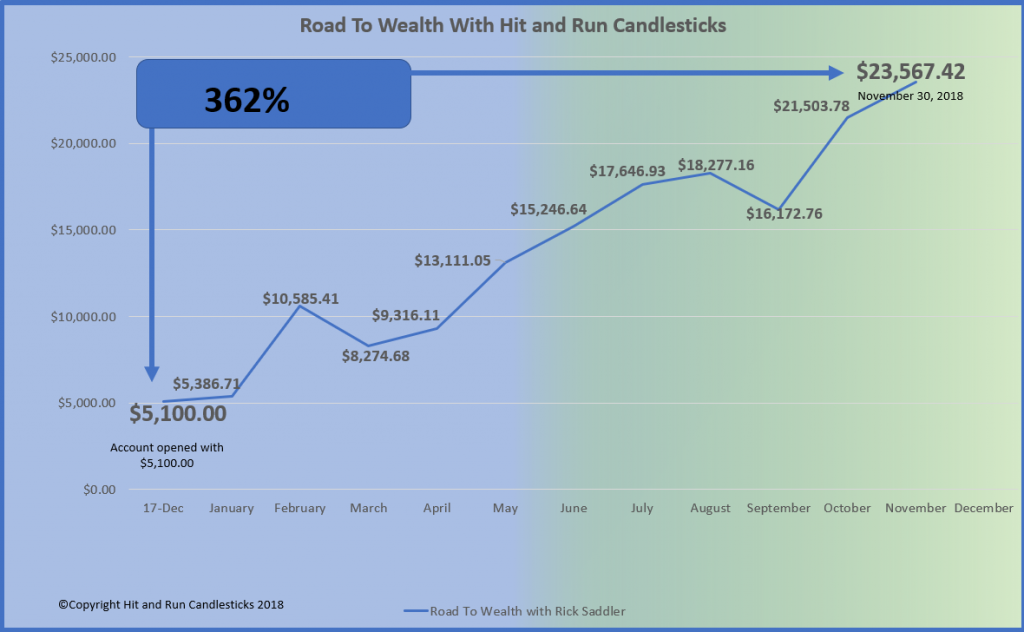
For 2019 Rick plans on taking the now $23,567.00account to $50,000.00 before December 31, 2019. Remember he already has increased the account $5,000.00 to $23,567.00 or 362% in 2018. Would you like to learn from someone that truly makes money, not just one hit wonders and backs it up with his account statement.
DISCLAIMER: Investing/ Trading involves significant financial risk and is not suitable for everyone. No communication from us should be considered as financial or trading advice. All information provided by it and Run Candlesticks Inc, its affiliates or representatives is intended for educational purposes only. You are advised to test any new approach before implementing it. Past performance does not guarantee future results. Terms of Service
The savvy trader knows how
to make money in all markets, but the savvy trader needs the right tools and understands
charts. Keep reading for a few of my thoughts. Bullish data is desperately needed,
or the bull will likely endure more pain. Currently, I see three events that could
potentially hurt or help the market. The first event is the FOMC statements this
week, the government shutdown, and the China trade issues. Currently, the SPY, DIA’s and QQQ’s are testing areas that could
lead to erasing 2017 gains just as we have seen in the 2018 gains.
Transports are looking broken and weak. The Transports ETF (IYT) has broken the bullish weekly trend line, ralliedfor a trendline challenge and failed. Price is looking for support, and withouta bullish catalyst, $162.40 looks to be inviting price.
Watchlist Ideas
We are adding PGR to our watchlist for a short trade. The weekly chart has failed top with bearish follow through. Last week’s weekly candle supported the Bearish Engulf and closed below the weekly50-SMA setting for a Blue Ice Failure strategy. For more information, (entry,Targets, and Stop) please join us in the trading room.A few others that we have on our trade list is MDB, DVMT, PG, KO, TXN, IMMU, NFLX. Past performance does not guaranteefuture results. Learn how to trade before you trade.
Yes, The Little Account Can!
For 2019 Rick plans on taking the now $23,567.00account to $50,000.00 before December 31, 2019. Remember he already has increased the account $5,000.00 to $23,567.00 or 362% in 2018. Would you like to learn from someone that truly makes money, not just one hit wonders and backs it up with his account statement.
DISCLAIMER: Investing/ Trading involves significant financial risk and is not suitable for everyone. No communication from us should be considered as financial or trading advice. All information provided by it and Run Candlesticks Inc, its affiliates or representatives is intended for educational purposes only. You are advised to test any new approach before implementing it. Past performance does not guarantee future results. Terms of Service
The market hates uncertainty and we this week we have an extra dose of political uncertainty to weigh on the mind of the market. While we watch and wait for new on China/US Trade negotiations, we have the FOMC rate decision and forecasts on Wednesday and the obvious tension that it creates as the market waits for the decision. If that’s not enough drama, we face the possibility of a government shut down on Friday if Congress and the Whitehouse can’t agree on the budget. The hanging point is the border wall so expect an none stop barrage of political spin for the market to chew on this week.
As I write this, the US Futures are pointing to a modest gap down at the open. It seems likely that the indexes will test lower supports but don’t rule out the possibility of a short-term oversold bounce to test the overnight futures highs. Although volatility remains high, there is a possibility of light and choppy price action as the market tests support levels and waits for the FOMC decision. As always maintain your discipline and say focused on price action an remember the next reversal may be just one news report away as the political uncertainty continues.
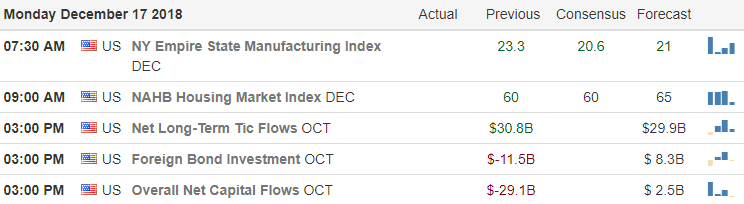
On the Calendar
We have 28 companies stepping up to report earnings this morning. Make
sure to keep up your due diligence as 2018 reports continue to wind down.
Action Plan
The Friday selling was disappointing but not all that shocking considering the political uncertainty that continues to swirl. On Wednesday, the market faces the question,will they are will they not decide to increase interest rates as originally expected? And then what do they see in the interest rate future with their FOMC Forecasts? If that’s not enough drama then keep in mind, the government could shut down on Friday unless the Congress and President agree on a new budget let alone the ongoing trade negotiations.
During the evening Futures were at one point slightly higher as the Asian indexes closed mixed but mostly higher. Unfortunately, European markets are all modestly lower this morning, and the US Futures are currently looking fora modestly lower open this morning, A test of lower supports seems very likely but don’t rule out the possibility of a bounce with T2122 indicating a short-term oversold condition. As the FOMC decision approaches to keep in mind that trading could become light and choppy as the market waits for the decision. As always stay disciplined and focused on price action.
Looks like members will take a little cash home today on the shorts and PUTS. Way To Go!! Yesterday I bought PUTs on the QQQ’s, and I know others who had PUTS on IWM, SPY and DIA’s
Yesterday S&P-500 ETF (SPY) closed below the T-Line for the 7th day in a row on the daily chart, and the weekly chart is still drawing a Doji. This week high$269.00 is what the buyers need to bust to gain any traction. The sellers look as if they want to revisit the October, November, December lows or close to them.
From Our Day Trading Division
Top Gun Day Trading had a fantastic week and a month so far. Here is the note I received from Steve Risner.
We finished the week +$1,445 for the week and are up $1,920 for the month. Have a great weekend everyone. We love the volatility in the market, in and out within a day. Sleep better at night
Yes, the little account can make it in the trading game, and the good traders can be better. Back in January this year I opened a little trading account to prove a prove a point (and to see if I could do it). The project was called “Road To Wealth.” I opened the account with $5,100.00, and as of 11/30/18, the account is worth $23,567.00 or a 362% increase.
If you would like to learn from someone that truly makes money not just one hit wonders and backs it up with his account statement. Click The Button Below
DISCLAIMER: Investing/ Trading involves significant financial risk and is not suitable for everyone. No communication from us should be considered as financial or trading advice. All information provided by it and Run Candlesticks Inc, its affiliates or representatives is intended for educational purposes only. You are advised to test any new approach before implementing it. Past performance does not guarantee future results. Terms of Service
A gap up and run of more than 450 points and a 3-hour selloff taking back nearly 300 before the close is a test of traders patience and discipline. Yesterday was the 5th huge daily whipsaw in as many days as the wild news driven volatility continues. This is a market for very fast and very skilled day traders and institutional algorithmic computers. So what is swing trader or position trader to do?
As hard as it may be, we must be patient and remain disciplined to our rules to protect capital and wait for our edge to return. Waiting is painful for most traders, but it’s far less painful than watching your money and confidence disappear trying to fight the tape. Obviously, this is very dangerous price action and if you find yourself losing money consistently for goodness sake stop repeating the same mistake expecting a different result. Like the old saying goes, If you find yourself in a hole, Stop Digging!
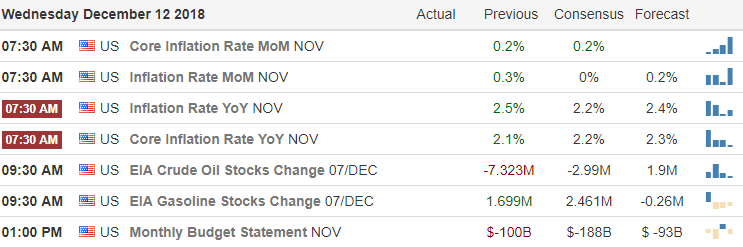
On the Calendar
On the Earnings Calendar,
we have 29 companies on the reporting today with ADBE as one of the most notable
after the bell.
Action Plan
As I write the US Futures are fluctuating between a slightly bullish open to a slightly bearish open but with Jobless Claims and Import/Export numbers out at 8:30 AM anything is possible by the open. Honestly, I was a little surprise because only 6 hours before futures were up 110 points! Let’s hope it can retest the overnight high later today. We can’t seem to get past the big price swings even in the overnight session following a roller-coaster ride yesterday which saw a rally of more than 400 points but gave back nearly 300 in the last 3 hours of trading.
With such wild volatility,we remain a very challenging day traders market, and we sit on the edge of our seat waiting for the next news driven reversal to occur at any moment. We all know better days will eventually return but the patience to wait for them is very difficult. Protect your capital and guard your confidence because both can easily evaporate during such volatility. Trading is a marathon, not a sprint so slow down and wait for your edge.
Looking at the two recentcandles on a weekly chart, I see a Doji battling a Bearish Engulf. The T-Line is trending below the 34-EMA, and now the 34-EMA is trending below the 50-SMA. Between$262.25 and $280.26, the buyers and sellers have been beating each other backan fourth creating a crazy amount of volatility in the market. The daily chart is fighting to create a little momentum above $262.25 to challenge the minefield up to the $280.25 area. Based on price action and the charts the bears have the advantage, and the bulls on have small relief rallies to work with.
Watchlist Ideas
GRPN is now on our trade list after it closed above the 50-SMA yesterday. We will use the Rounded Bottom Breakout trade plan and rules. A few others that we have on our trade list is MRK, TWTR, PG, MSFT, TWLO, VIPS, CSIQ, GRPN, ETSY, FEYE, FEYE, ABX, NEM. Past performance does not guarantee future results. Learn how to trade before you trade.
Yes, The Little Account Can!
Yes, the little account can make it in the trading game, and the good traders can be better. Back in January this year I opened a little trading account to prove a prove a point (and to see if I could do it). The project was called “Road To Wealth.” I opened the account with $5,100.00, and as of 11/30/18, the account is worth$23,567.00 or a 362% increase.
DISCLAIMER: Investing/ Trading involves significant financial risk and is not suitable for everyone. No communication from us should be considered as financial or trading advice. All information provided by it and Run Candlesticks Inc, its affiliates or representatives is intended for educational purposes only. You are advised to test any new approach before implementing it. Past performance does not guarantee future results. Terms of Service