How much risk are you willing to take heading into a weekend
with so much political uncertainty? A question that many traders will be pondering
today as the congressional budget battle enters
its last hours before shutting down the government. Will they agree
before midnight and how much capital are you willing to risk on their
decision? If they avert a shutdown, the market
could be higher on Monday but should they fail it could easily be sharply lower. A pretty big risk for hard earned capital.
As for me, I choose
not to gamble on a political decision. I
will exercise my discipline and wait patiently
for my edge to return and price action proof before risking more capital. If by chance an agreement is made before the market close
today, I will reevaluate and make decisions
based on the price action, not speculation or prediction. Until then I will protect my capital and rest
well this weekend avoiding this ridiculous political uncertainty.
On the Calendar
On the Earnings Calendar,
we have only 14 companies reporting today
with KMX as the most notable.
Action Plan
Although the market seems currently oversold futures are
pointing to more selling this morning. Asian closed sharply lower and European markets are also
under pressure this morning. The border
wall budget battle seems like it’s rapidly headed for a government shut down. The President says he will sign the House version
on of the continuing resolution, but the Senate says no deal. Sadly this
could be a very rough day of price action
unless someone backs down and a government closure is averted.
We could bounce at any time
yet at the same time the political uncertainty could easily drive the market substantially
lower. That makes for some very tough
decisions regarding the risks of holding through the weekend. I want to believe
that cooler heads will prevail and a last minute deal will finally provide some
relief to the selling, but I trade on price action proof, not hope and speculation. An old
saying comes to mind, “The market can
stay irrational much longer than I can say liquid.” Consequently, I choose to protect my capital until price action
improves. I wish you all a wonderful
weekend!
Yesterday we closedour LULU PUT trade with 13% profit, nothing big but a solid base hit. Another base hit we are looking for is VXX trade, most likely we will close it out today
Ok so rate hike is behind us, and now we have the government shut down to consider. It is a shame that the government uses innocent peoples paycheck as a bargaining chip. Honestly shut the damn government down but pay people what you have promised.
TC2000 T2122 Chart – The four weeks New High/Low Ratio has dropped lower into the oversold area and Stochastics is deep within the oversold area of the chart. On the weekly chart, the SPY has found the Dotted Duece, and the 200-SMA weekly is not to far below. Price and the T-Line are still leading the run down in both the daily and weekly charts. We have now pulled back to the 61.8 fibs measured from early 2017 to the 2018 highs. FYI I am just pointing out a few points I see on the charts, the questions we talk about in the trading room is what do we do with that information.
Hit and RunCandlesticks and Right Way Options have opened our doors forthe holidays; this would be a great time to get to know us, ask a question aboutour service and put a few $$$ in your pocket. Trading Rooms #1 and #2 no password required – https://hitandruncandlesticks.com/trading-rooms/
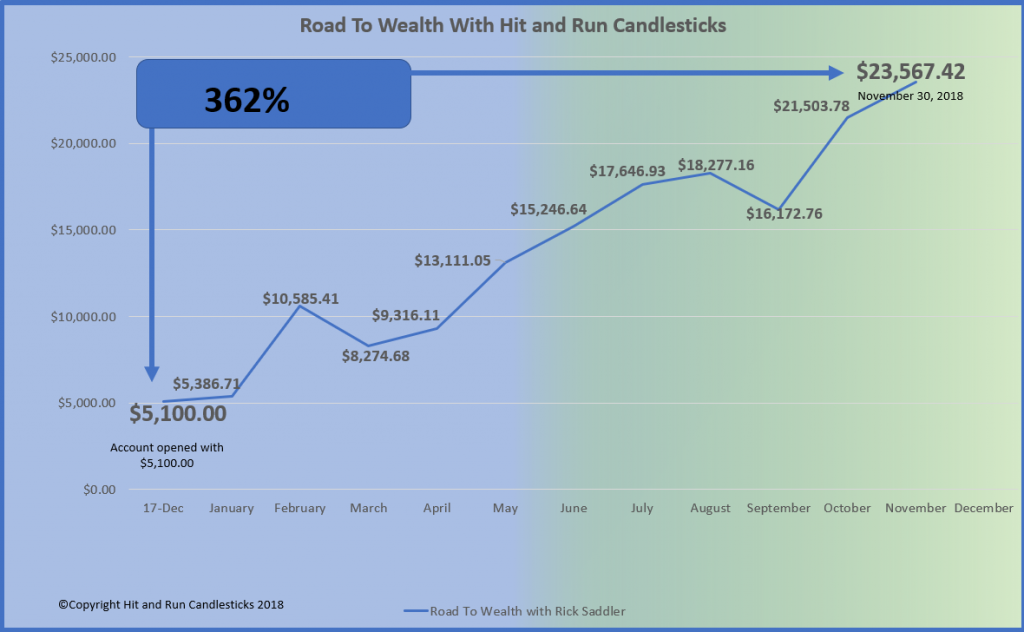
For 2019 Rick plans on taking the now $23,567.00account to $50,000.00 before December 31, 2019. Remember he already has increased the account $5,000.00 to $23,567.00 or 362% in 2018. Would you like to learn from someone that truly makes money, not just one hit wonders and backs it up with his account statement.
DISCLAIMER: Investing/ Trading involves significant financial risk and is not suitable for everyone. No communication from us should be considered as financial or trading advice. All information provided by it and Run Candlesticks Inc, its affiliates or representatives is intended for educational purposes only. You are advised to test any new approach before implementing it. Past performance does not guarantee future results. Terms of Service
Is there a probability ofprice bouncing to test the T-Line? I would expect so over the next few days; thiswould also set up better short patterns. When I look at the SPY chart, I see fivenew lows in a row which tells me not to chase. Please note a relief rallybounce is only that. After the Bearish T-Line Run, we have had we wouldn’t wantto be chasing.
The SPY posted anotherlow ($249.35) and closed off the highs of ($251.26). The sellers continue to commandthe show. The buyers would have to close over $259.391 to even get a mention.On the weekly chart, the Dotted Duece is at ($247.25), price is only about$2.00 away. The T2122 chart is very oversold, and the 12.3.3 stochastics indicatoris oversold, could we see a bounce? Yes, we could, but it would take buyers, sofollow price action. The best way I have found to follow price is to look athow price action is trending compared to the T-Line.
Hit and RunCandlesticks and Right Way Options have opened our doors forthe holidays; this would be a great time to get to know us, ask a question aboutour service and put a few $$$ in your pocket. Trading Rooms #1 and #2 no password required – https://hitandruncandlesticks.com/trading-rooms/
Long and ShortTrade-Ideas
GE, PANW, YELP, ZTS, MTCH, LULU are on our watchlist for a possible trade today or within the next few days.
GE is our featured trade-idea today as it comes out of a Pinball set up and the bottom it is constructing. We will look at GE when itcloses over $7.95 with a test of support. A stock swing trade to about the50-SMA (14%) or an Options Trade of 30-40% or more. Members log in for moredetails. Past performance does not guarantee future results. Learn how to tradebefore you trade.
For 2019 Rick plans on taking the now $23,567.00account to $50,000.00 before December 31, 2019. Remember he already has increased the account $5,000.00 to $23,567.00 or 362% in 2018. Would you like to learn from someone that truly makes money, not just one hit wonders and backs it up with his account statement.
DISCLAIMER: Investing/ Trading involves significant financial risk and is not suitable for everyone. No communication from us should be considered as financial or trading advice. All information provided by it and Run Candlesticks Inc, its affiliates or representatives is intended for educational purposes only. You are advised to test any new approach before implementing it. Past performance does not guarantee future results. Terms of Service
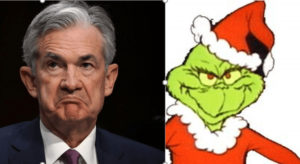
With a December rate increase and the two more expected next year, Jerome Powell is officially The Grinch who Stole Christmas. Another wild day of price action with the Dow swinging nearly 900 points for the high to low. Futures during the night were also very volatile falling an additional 200 points before bouncing and now suggesting a modestly higher open today. Sadly with such wild price action, we can’t rule out the possibility that sometime during the day a test of the overnight low.
In the very short-term,we appear to be in an oversold condition, and a relief rally of sorts could begin at any time. Unfortunately, with so much technical damage, extreme volatility and the holiday’s just around the corner any reaction higher could bring in more risk off sellers. Keep in mind as the holiday’s draw near volumes are likely to decline as traders take time off to celebrate.
On the Calendar
On the Earnings Calendar, we have 34 companies reporting earnings. Noteworthy Earnings Reports: CAN, BB, CAG, NKE, WBA
Action Plan
The Good: Indexes bounced slightly before the close at lower support levels. The VIX suggests fear is high but surprisingly held at price resistance. T2122 indicates we are in the bounce zone and futures are suggesting a modestly higher open. Last but not least Jerome Powell expects a strong economy in 2019.
The Bad: The indexes broke major support levels dropping sharply and quickly to test lower levels. All four indexes have now entered the death cross with the DIA yesterday joining the other three adding to the technical damage.
The Ugly: With nearly a 900 point swing from high to low yesterday volatility remains very high. With that in mind, we should not rule out the possibility of testing the overnight futures lows at some point during the day which is more than 200 points lower. It looks like Congress is kicking the can down the road to February before making a decision on the budget which means the political uncertainty is likely to continue to plague the markets into next year.
As we head into the weekend, consider the risk carefully and know that anything is possible.
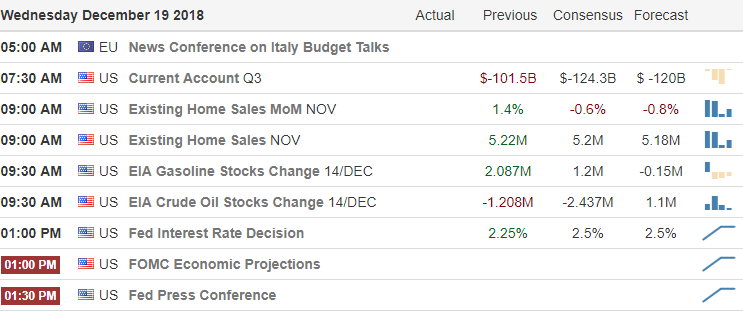
The question of the day, What will the FOMC decide at 2:00 PM ET time today? The world is watching, and pressure continues to mount as the WSJ the president and even Cramer have chimed in that the Fed should not raise rates. However,the Fed Funds Futures suggest that there is better than a 70% chance that the FOMC will stick to its plans increasing the rate by 25 basis points. Then there is the question of the FOMC forecast? Will they continue with their aggressively hawkish stance or will they soften their outlook with a more dovish look forward.
As a trader, the truth is it really doesn’t matter what the Fed does or doesn’t do. What matters is how the market responds to their decision and how we as traders react the price action. Currently, the Dow Futures indicate a substantial gap up of nearly 200 points. We should expect substantial volatility and watch for possible full whipsaw reveals as we wait for the FOMC decision. After the decision expect tremendously violent price swings, the market reacts all the way through the Chairman’s press conference. Buckle up it could be a very bumpy ride!
On the Calendar
On the Earnings Calendar,we have 23 companies reporting earning stoday. Among those reporting are GIS, PAYX, PIR, RAD, WGO as some of the most notable.
Action Plan
A budget deal in Italy, some improvement in US budget negotiations and a possibly more accommodating FOMC is lifting the mood of US Futures this morning. As I write this futures are suggesting a triple point gap up at the open. The question is will the Bull be able to hold and defend the gap as we wait for the FOMC decision at 2:00 PM ET or will we continue whipsaw? We should expect a volatile day and if you decide to trade plan to be very nimble and a substantial tolerance to risk.
Fed fund futures indicate better than a 70% chance that the FOMC will follow-through on their plans to raise interest rates by 25 basis points. If they do, does mean the market will necessarily fall? No. However, it will require to Fed to sound much more dovish in their forecast. With the current state of the market, there is, of course, tremendous anticipation surrounding this event. Expect extreme price volatility after the release the may reverse directions several times all the way through the chairman’s press conference.
The focus will be onMr. Powell and the FOMC at 2:00 pm today. Does Powel announce a rate hike today? The words he uses for the future will be just as important, but more importantly is how the market interprets the information given.
No surprise the price action of the SPY is still bearish in relationship to the T-Line and the T-Line, 34-EMA, and 50-SMA are trending lower below the 200-SMA. The candle actionof the last two days has printed a Tweezer Bottom in a possible support area. ATweezer Bottom on support is just a clue in the big picture. Bullish follow-throughis required for any bullish meaning. And support means very little withoutbullish confirmation. Let’s fasten our seatbelts and keep our arms and legsinside the bus, could get crazy today.
Hit and RunCandlesticks and Right Way Options have opened our doors forthe holidays; this would be a great time to get to know us, ask a question aboutour service and put a few $$$ in your pocket. Trading Rooms #1 and #2 no password required – https://hitandruncandlesticks.com/trading-rooms/
Long and ShortTrade-Ideas
AG, FSM, PHM, NEM, AES, USFD, ESRX, AVGO, COP, SEAS are on our watchlist for a possible trade today or within the next few days.
AG is our featured trade-idea today because it alerted an (RBB) RoundedBottom Breakout with a Stock Swing Trade of about 10% or more and an Options Trade of 30% or more. Members log in for more details. Past performance does not guarantee future results.
For 2019 Rick plans on taking the now $23,567.00account to $50,000.00 before December 31, 2019. Remember he already has increased the account $5,000.00 to $23,567.00 or 362% in 2018. Would you like to learn from someone that truly makes money, not just one hit wonders and backs it up with his account statement.
DISCLAIMER: Investing/ Trading involves significant financial risk and is not suitable for everyone. No communication from us should be considered as financial or trading advice. All information provided by it and Run Candlesticks Inc, its affiliates or representatives is intended for educational purposes only. You are advised to test any new approach before implementing it. Past performance does not guarantee future results. Terms of Service
A morning gap down that whipsawed into the green only to be whipsawed once again to new lows is quickly approaching critical weekly index supports. If they fail to hold this selloff could get much worse very quickly. All eyes are on the FOMC and Jerome Powell,wondering if they will stick to their aggressive rate increase stance or if recent events will make them reconsider. If they raise, I suspect the weekly lows will fail. Should they begin to talk more dovish, the market could substantially rally.
Are you willing to gamble on that decision or will you stand aside to protect your capital? Every day I hear from struggling traders searching for answers as they watch their accounts chopped to pieces and suffering huge losses trying to trade the extreme volatility. If you find yourself consistently losing money then stop trading! You’re the boss so make the decision to protect your capital and wait for the market to stabilize. Cash is a position! Better days will eventually return, but if you lose all your capital trying to fight the market, you won’t be here to take advantage of it.
On the Calendar
On the Earnings Calendar,
we have 23 companies reporting today.
Notable today is FDX, MU, DRI, FDS, JBL, SCS reports.
Action Plan
In yesterdays note I suggested the possibility of a bounce. After the morning gap and some follow-through selling, we did get a bounce. Unfortunately,it lasted for only a couple of hours recovering the morning losses then failing at Friday’s resistance lows creating a double intraday whipsaw. When you look at the index charts its tough to anything but gloom with the financial and political news reinforcing that sentiment. Fear of the unknown is a powerful tool of the bears that have chased away any notion of a Santa rally this year.
As we rapidly approach weekly index supports the market is trying to send a strong signal to the FOMC and Jerome Powell to take a less aggressive approach to interest rate increases. Although it’s not the job of the FOMC to protect the market, they certainly played a part in this selloff. They have signaled a December rate increase is likely, but hopefully, they have received the message of the market and will reconsider. After that, we have the possible closure of the Federal government on Saturday if the Congress and President can’t agree on a budget. Be very careful and remember that cash is a position!