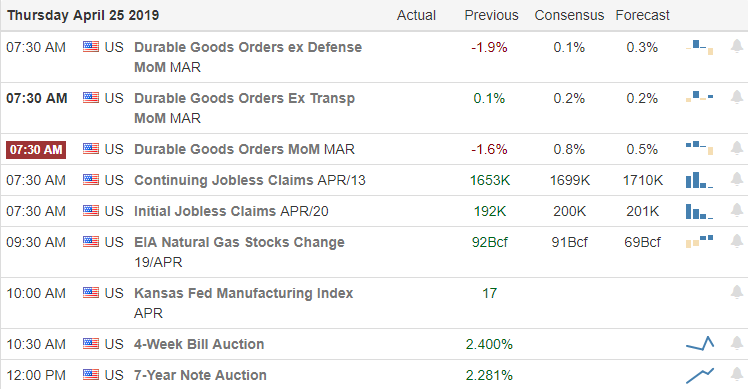
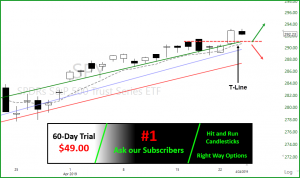
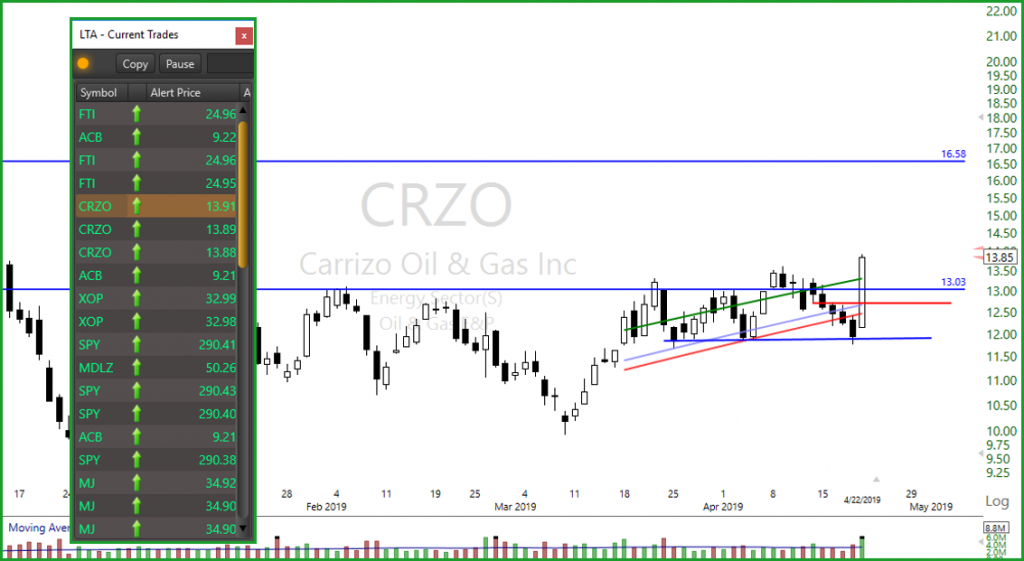
A close over the T-Line today would be the 15th-day price action has to lead the T-Line into bullish battle. Price has tightened up the last three days, the Doji yesterday is the smallest of the 3 and yesterdays low was higher then Wednesdays candle. The past three candles have also had slide into last weeks support area. This week the sellers have tried to push the buyers into a hole but have failed thus far, the buyers have hung on tight to the road traveled from the December lows. A strong bull will be wanting $266.50 followed by $270.50 a strong bear will want $258.60 followed by $255.65. The VIX-X price action has failed to close above the 50-SMA after a minor challenge. But the bottom building is possible and real.
Friday is a good day to collect a fw of those profits and take a few loss if needed. It’s kinda scary holding too much over the weekend with all the political BS and the unknown. Good trading to all and have a great weekend.
Discounts and Coupons
Hit and Run Candlesticks is has a 30% savings on memberships – use the SAVE30 promo code and save 30% on and Hit and Run Candlesticks membership. Learn More SAVE30
Private 2-hour coaching with Rick Saddler only $354.00 for non-members and $300.00 for members. Learn More
The “Road to Wealth Coaching” – Work with Rick Saddler daily and learn how he plans to double his trading account this year 2019. Learn More
Real-Time Market Scanner
The LTA Live Real-Time Scanner is built for both the professional and the retail home trader. The live real-time scanner offers a cutting edge advantage to the serious trading looking to profit from the stock market. Scan Definitions- Download FREE
DISCLAIMER: Investing/ Trading involves significant financial risk and is not suitable for everyone. No communication from us should be considered as financial or trading advice. All information provided by it and Run Candlesticks Inc, its affiliates or representatives is intended for educational purposes only. You are advised to test any new approach before implementing it. Past performance does not guarantee future results. Terms of Service
Our government works in mysterious ways as two failed votes
to reopen the government inspires confidence that a compromise may be forthcoming.
That hope is inspiring the bulls this morning with the US Futures
suggesting a substantial gap up
open. Earnings, Durable Goods Orders, and
New Hope Sales results may enhance the bullishness or temper that sentiment by
the open but so far the bulls appear firmly
in control.
While the indexes were content to consolidate there was steady
buying pressure showing up in a lot of stocks
yesterday. I personally found it very difficult not to overextend myself with so many great looking chart patterns and
setups appearing. As for now, this is a stock pickers market with a lot of good price action signals. Unfortunately,
we still have to hold our breath as we enter positions because all the
government uncertainty could easily reverse the current sentiment in about half
a heartbeat. Keep that in mind as you
consider the weekend ahead and the risk that can bring to your portfolio.
On the Calendar
Durable Goods Orders – Consensus – 8:30 AM Eastern
New Home Sales – Consensus – 10: AM Eastern
Baker-Hughes Rig Count – 1:00 PM ET
On the Earnings Calendar,
we have 38 companies reporting. Notable
today: ABBV, APD, CL, DHI, LEA, NEE, SYF, & VOD.
Action Plan
While the indexes continued to consolidate yesterday, there was consistent buying pressure
showing up in a significant number of stocks.
So many in fact it was difficult to
stick to my plan and avoid becoming over-committed while still testing
resistance in the indexes. Both bills voted
on yesterday to reopen the government failed, but
that is now being viewed as a good thing because Senate leadership is finally
trying to work out a compromise.
Overnight Asian markets rallied despite the trade war
jitters that continue to crop up every few days. European markets are also bullish this
morning helping the US Futures point a substantial gap up open of more than 150
points as a write this. Of course
Earnings and the two big economic reports could certainly change that before
the open. With the renewed hope that the government shutdown may
soon consider your holdings carefully as
we move into the weekend. If the market
does open with a nice gap up, I will likely
bank some profits to reduce my weekend risk.
I wish you all a great day and a fantastic
weekend!
Buyers are holding off the sellers in this bullish pullback. The SPY printed another lower low yesterday, and then the buyers stepped over the sellers closing well above the low. The price action of the SPY is flirting with-testing the 50-SMA and the $258.60 support area, what I would call a bullish pullback. Here is why I think the bullish pullback is good for the overall market, let’s look at the past five candles. The past five candles are drawing what could be a bullish continuation pattern, of course, it is based on the buyers holding support. If the bullish continuation pattern pans out the next target area would be about $270.50. And if the sellers walk all over the buyers $255.65 and $251.40 will be in the cards.
Notice how price action is trending above the T-Line and the Red/Green Dottrend in the chart below, we will remain cautiously bullish until we see a compelling bearish candlestick pattern with follow-through the breaks the bullish trend.
For more information about the Red/Green Trend line, Dotted Deuce or anything about our charts, consider joining us in the HRC trading room. We start at 9:10 Am each trading day. 60-Day Trial
Stock picks or trade ideas without swing trading education will cost you your hard earned money. HRC Watch-list Trade-Ideas – We are adding the following to our trade-list: LGIH, SEDG, EXTR, DF, CLVS, FSK, LLY, TWTR. Invest in your future with Hit and Run Candlesticks education Past performance does not guarantee future.
Real-Time Market Scanner
Built-In (Included) Scan Definitions. Bullish and bearish, Continuation, moving average crossovers and bounces. (RBB) Rounded Bottom Breakout alerts, intra-day, daily and weekly, Candlesticks stick signals and more. Scan Definitions- Download FREE
DISCLAIMER: Investing/ Trading involves significant financial risk and is not suitable for everyone. No communication from us should be considered as financial or trading advice. All information provided by it and Run Candlesticks Inc, its affiliates or representatives is intended for educational purposes only. You are advised to test any new approach before implementing it. Past performance does not guarantee future results. Terms of Service
The market appears stuck
between a rock and a hard place as talk of an economic
slowdown, political uncertainty both domestic
and abroad, and earnings season unfolds.
Indexes dance between significant levels of price resistance and current short-term trend supports waiting for
the event that will determine direction.
While I believe it’s very healthy that the markets are consolidating all
the outside influences means traders will have stay on their toes and prepared for just about anything.
Be cautious about over-committing
to a directional bias as we chop around in this tight price action range. Just one event could change direction, and unfortunately,
that could easily happen overnight. Yesterday’s
whipsaw price action should serve as a reminder
of a nervous market and how quickly sentiment
can shift.
On the Calendar
On the Earnings Calendar,
we have the biggest day this week with 125 companies reporting results. Notable
earnings: ISRG, ALK, BMY, DFS, ETFC, FCX, HBAN, INTC, JBLU, MKC, NSC,
RCI, LUV, SBUX, UNP, GWW, WDC.
Action Plan
There was more conversation from IMF’s Lagarde about an economic slowdown overnight with China as the
point of concern. As a result, we see muted and mixed markets around the world. As I write this US Futures, suggest a flat open, but
I suspect that could change dramatically as the morning earnings results roll
out. Two bills to end the government
shutdown mover forward to a today but
both are currently expected to fail. That’s
really not important, but the heightened political spin leading up to
the vote and the aftermath could certainly
affect the market attitude.
As of now the Bulls and Bears appear deadlock with the
indexes slipping into a consolidation range.
Personally, I think this rest is healthy
for the market as we build a level of price action support just above the 50-day
moving averages. Unfortunately, with all the political uncertainty, economic
slowdown talk and earnings results just one event
could substantially change market sentiment.
That could mean a fast move up or a fast move down, and traders should
prepare for the possibility of either. A
directional over-commitment could be a mistake as we continue to dance between
support and resistance levels.
DISCLAIMER: Investing/ Trading involves significant financial risk and is not suitable for everyone. No communication from us should be considered as financial or trading advice. All information provided by it and Run Candlesticks Inc, its affiliates or representatives is intended for educational purposes only. You are advised to test any new approach before implementing it. Past performance does not guarantee future results. Terms of Service
The trade war with China set off a little selling yesterday bringing in fear to the market, as stated yesterday we are cautiously bullish. As you can see from the 4-hour chart, the trend went from red to green. Price has followed the green dot trend challenging the Dotted Duece. Yesterdays fear brought in what looks like normal profit taking down to a minor support line and still above the $258.40 support line. With price closing above the $258.40 trend line and the Red/Green Dot trend, we will remain cautiously bullish until we see a compelling bearish candlestick pattern with follow-through the breaks the bullish trend.
For more information about the Red/Green Trend line, Dotted Deuce or anything about our charts, please consider joining us in the HRC trading room. We start at 9:10 Am each trading day.
VIX–X Chart – The Vix chart became a little bullish yesterday, and we are watching it like a hawk. If we see Bullish follow-through from the Morning Star signal printed yesterday, we will reevaluate ous trades and look at shorts/Puts
Stock picks or trade ideas without the education will cost you your hard earned money. HRC Watch-list Trade-Ideas – We are adding the following to our trade-list: BERY, BBBY, PG, EA, SLB. Learn how to trade before you trade. Past performance does not guarantee future.
Real-Time Market Scanner
Built-In (Included) Scan Definitions. Bullish and bearish, Continuation, moving average crossovers and bounces. (RBB) Rounded Bottom Breakout alerts, intra-day, daily and weekly, Candlesticks stick signals and more. Scan Definitions- Download FREE
DISCLAIMER: Investing/ Trading involves significant financial risk and is not suitable for everyone. No communication from us should be considered as financial or trading advice. All information provided by it and Run Candlesticks Inc, its affiliates or representatives is intended for educational purposes only. You are advised to test any new approach before implementing it. Past performance does not guarantee future results. Terms of Service
Although the selloff yesterday may have been painful for may
long traders there was a silver lining showing at the close. After a hard test of their daily 50-averages, all four
of the major indexes bounced and closed at or just above this key psychological
support. This morning US Futures are
currently suggesting a bullish open, but
a lot will depend on the morning earnings
reports if that holds.
With little on the Economic Calendar today, political uncertainty
and global growth concerns, there is significant
pressure for companies to perform and prove they
can support current price levels.
Yesterday the VIX indicated a little fear is coming back into the market. Couple that with earnings and we have a recipe
for increased volatility hinged directly upon earnings results.
On the Calendar
On the Earnings Calendar, we
have 93 companies reporting today.
Notable reports, F, ABT, CP, CTXS, CCI, FFIV, KMB, LRCX, LVS, NG, PG,
TXN, UTX, & XLNX.
Action Plan
A decline of 3% in Existing Home Sales yesterday enhanced the
premarket fears of an economic slowdown pushing the Dow down 300 points. However, after a hard test of the daily 50-averages, the bulls responded showing at
least an initial willingness to defend it as support. As tenuous
as it may seem, the uptrend is still valid thus far and perhaps we a consolidation
will develop. Earnings Reports will be a
key element over the next few weeks that determine
market direction.
According to new reports,
the Presidents proposal to reopen the government will come to a vote later this
week, but the opposition vows it will not pass.
Pressure from employee groups continues
to increase as some 800,000 continue to work without pay. Futures this morning are pointing to a
bullish open currently suggesting a gap up of more than 100 points providing
some relief to yesterday selloff. Unfortunately, the bullishness has little to no
tailwinds with Asian market having closed
nearly flat on the day and European markets
mixed but currently mostly lower. With little
on Economic Calendar, today Earnings Reports
will be in high focus.
Three day weekends are a nice
break for traders, but they tend to create volatile price action and market
reversals upon the reopening. On Friday
I mentioned my intention of taking profits and reducing risk ahead of the long
weekend. With the futures currently
suggesting a Dow gap down between 150 and 200 points at the open, I’m that my
profits safely tucked away before the close on Friday.
Should we not panic as if the sky is falling? No, after such a huge market runs a pullback or consolidation is normal and
healthy as long as price support hold and the
bulls show a willingness to defend them.
The IMF report citing global growth concerns have markets around the world
reacting negatively to the possibility of an economic slowdown. However, the real test for our market will be
company earnings reports. So stay focused
on price action, support, resistance, and trend for clues to market direction.
On the Calendar
We have 81 companies reporting earnings today with notable earnings COF, FITB, HAL, JNJ, PETS,
PLD, STLD, AMTD, TRV, UBS & ZION.
Action Plan
Concerns on of global growth concerns after an IMF report, the
Government Shutdown in entering day 32 and new concerns about US/Trade negotiation progress have the bears pushing a bearish open today. Asian markets all closed in the red overnight,
and European
markets are also lower across the board. As a result,
Futures are currently pointing to gap down open between 150 to 200 points lower
at the open.
The economic report of Existing Home Sales and a significant
number of Earnings Reports this morning could easily improve or worsen the situation
depending upon the results. As nasty as
this gap down may seem at the moment, keep in
mind the indexes are currently holding above price support levels and their
respective 50-day moving averages. The expected
pullback or consolidation is a healthy thing as long as the bulls defend
support levels. Keep in mind earnings season
tends to increase market volatility and big morning reactions are typical. Which means bearish markets can reverse
bullish and vice-versa so remain flexible and focused on the price action and
the patterns within the charts.
Last week on the daily chart the SPY broke through the 50-SMA and the following day price action produced bullish follow-through. As of Friday we have had an 11-day bullish T-Line Run showing the strength and determination of the bulls. Both the Dotted Duece and 200-SMA are just above for the bulls to take.
The weekly Candleless chart the 3-EMA is just now coming up to meet the T-Line (8-EMA), and both the 34-EMA and 50-SMA are still in bear territory. Over the years of trading, I have learned to respect the T-Line trend and how price action and other moving averages act around it. The daily chart has cut through the first layer of the resistance skin and is suggesting a good bullish trend working its way back up through the 50SMA while price moves up and down as it should. The week chart 3-EMA still lags below the T-Line. (Cautiously Bullish)
VIX–X Chart – 15-candles below the T-Line, Doji close Friday on the 200-SMA. The T2122 chart closed Friday at 99.27
Stock picks or trade ideas without the education will cost you your hard earned money. HRC Watch-list Trade-Ideas – We are adding the following to our trade-list: RMBS, EA, NVDA, WDAY, URI, RIG, DVN. Learn how to trade before you trade. Past performance does not guarantee future.
Real-Time Market Scanner
Built-In (Included) Scan Definitions. Bullish and bearish, Continuation, moving average crossovers and bounces. (RBB) Rounded Bottom Breakout alerts, intra-day, daily and weekly, Candlesticks stick signals and more. Scan Definitions- Download FREE
Road To Wealth With Rick Saddler
Road To Wealth Coaching Looking for extended coaching? Serious out trading? Work with Rick Saddler on a daily basis. Read More
DISCLAIMER: Investing/ Trading involves significant financial risk and is not suitable for everyone. No communication from us should be considered as financial or trading advice. All information provided by it and Run Candlesticks Inc, its affiliates or representatives is intended for educational purposes only. You are advised to test any new approach before implementing it. Past performance does not guarantee future results. Terms of Service