Bearish Engulfing Candle Patterns

Bearish Engulfing Candle Patterns

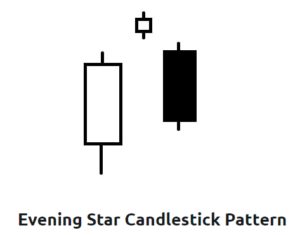
The bearish engulfing candle patterns left behind on the DIA, SPY and IWM yesterday suggest the wild bullish rally may have run out energy but I would not expect the bulls to give easily.  Logic alone would suggest after such an energetic rally that little rest or pullback is likely.  However, if the bulls can defend the reclaimed 50-day morning averages as support a case for attacking all-time market highs is possible.

Unfortunately tough talk between US/China is not suggesting that a trade deal between the countries is unlikely at the G20 meeting seems to have given the bulls a little pause this morning.  Asian markets closed lower as their consumer prices hit a 15 month high and food prices spiked 7.7% in the May report.  European markets are also seeing some bearishness this morning with all indexes pointing modestly lower.  As the bulls and bears battle for control expect higher price volatility and sensitivity to trade news.

On the Calendar

calendar

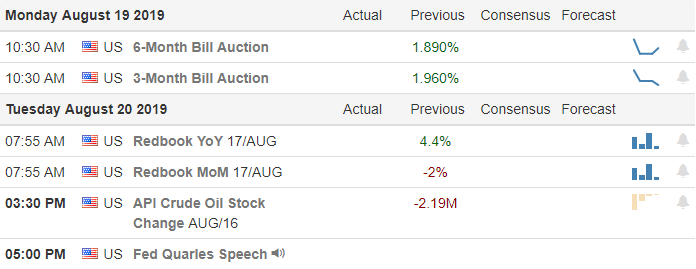
On the Wednesday Earnings Calendar we have just 15 companies stepping up to the plate.  Notable reports include LULU & TLRD.

Action Plan

Tough talk suggesting that a US/China trade deal is very unlikely at the G20 seems to have dampened the bullishness we have seen in the last week of price action.  During the night China released consumer inflation numbers showing a 15 month high and food prices spiking 7.7% in May.  Asian markets closed lower across the board overnight as a result.  European markets are also seeing red this morning across their major indexes. 

As I write this US futures are modestly lower bouncing off the overnight lows but the CPI number at 8:30 AM Eastern has the potential to move the market before the open today.  The DIA, SPY and IWM all left behind bearish engulfing patterns yesterday suggesting a lower print but I would not expect the bulls to give up control easily.  Expect high price volatility and the possibility of quick intraday reversals as they duke it out.  We should be just fine if the bulls defend the reclaimed 50-day moving averages as support but if these key psychological levels fail the bears could be emboldened.

Trade Wisely,

Doug

How About Those St Louis Blues

💲 Congratulations – St. Louis Blues “Stanley Cup Winners!” No trades were closed yesterday 6/12/19.  We did PFE Sept. $41.00 Calls and explained in the trading room in detail why we did. Having the right tools and an understanding of Candlesticks signals make all the difference in the world. The LTA Live Trading Alert Scanner and the Hit and Run family is the best of the best. All buys and closes announced in HRC Live Trading Room, be sure to tune in starting at 9:10 Eastern when I’ll review the markets, trade ideas.

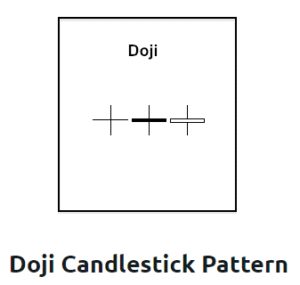
It looks as if the futures are a little bullish this morning and may try to challenge the @289.25 line or the top of the Doji yesterday. A positive close over $289.25 could put a spark in one of the bull’s eyes; the other eye will be on that Bearish Engulf that will want to defend the current top.  Bullish Follow-though at the close will be important to be overly long. Fed talk coming up will be an important factor in price action, trading until then could be a little erratic and sloppy. The VXX is still under the T-Line (No Fear) and still under the lowest T-Line Channel we use (still no Fear). If the VXX can get over $28.30, we could see the (Fear).

👉 Yesterday Tuesday, June 12/19, we did not close any trades, but we did buy PFE, PFE Sept. $41.00 Calls and explained in the trading room in detail why we did.

🎯 PFE is one for the watchlist; We did buy it yesterday as it was posting a T-Line Band Alert and a Piercing Candle on the LTA Alert Scanner. (see chart below) An Inside day today and a qualified chart pattern above $43.25. 🍰 The LTA Alert Scanner and 🍰 TC2000 are my tools of choice because they work!. Rick and the HRC Members kick off the trading room starting at 9:10 Eastern when we review the markets, trade ideas, and PFE. Other charts we plan to cover is: TNDN, SNAP, SHOP, PFE, MNST and BABA

✅ A Traders Edge In All Markets

The LTA Scanner can filter out charts that are trending, up or down and alert on charts that have Candlestick signals and patterns, western patterns and when indicators, such as MACD, Stochastics, RSI or Bollinger Bands have crossed or reaches the desired level. Hey, check out the NEW BULL PERFECT TREND ALERT. The right tools for the job.

Acton Plan

  1. ✅ Be patient. Know what you want and be patient
  2. ✅ Always plane your trade out
  3. Use our base hit strategy, sell into strength
  4. Buy close to your stop and support
  5. USE the LTA Trade Alert Scanner to find the winners

We use 2 of The Worlds Best Trading Tools, TC2000 for charting, LTA-Live Trading Alerts for real-time price action, candle and candle patterns, and western patterns. The right tools for the right job.👍

Free YouTube Education  •  Subscription PlansPrivate 2-Hour Coaching

DISCLAIMER: Investing / Trading involves significant financial risk and is not suitable for everyone. No communication from Hit and Run Candlesticks Inc, its affiliates or representatives is not financial or trading advice. All information provided by Hit and Run Candlesticks Inc, its affiliates and representatives are intended for educational purposes only. You are advised to test any new trading approach before implementing it.  Past performance does not guarantee future results.  Terms of Service

Who would have guessed?

Who would have guessed

Is the move irrational behavior?  Goldman Sachs has warned that it is and the conspiracy theorists come out of the woodwork proclaiming a rigged market.  The fact is the market wants to go up for the time being.  Fight it and you’re likely to lose because a market can remain irrational much longer than we as retail traders can stay liquid!  Follow the price action and avoid predicting.  Could today bring in the sellers?  Yes, but it could also inspire the bulls to keep pushing higher.  Relax, focus on price and it will lead the way.

Who would have guessed the hope of a federal funds rate cut from 2.5 percent to 2.25 percent would have the power to reverse market sentiment lifting the Dow more than 1250 points in just 5-days of trading.  This morning with fresh presidential tariff threats making headlines the US futures point to yet another gap triple point gap up.  

On the Calendar

calendar

We have just 19 companies fessing up to their quarterly results today.  Notable reports include Play & HRB.

Action Plan

The power of the assumed future interest rate cut continues to propel the bulls higher even as signs of a weakening economy emerge in the US and continued threats of tariff increases from the Whitehouse.  The biggest part of yesterdays move occurred in the overnight gap and according to the futures we can expect yet another gap up of more than 100 Dow points. 

In the past I would try to figure out such price movements that seem to be completely irrational.  I would attempt to countertrend trade these relentless moves only get run over by market momentum.  Here are the simple facts.  The bulls are currently in control and they currently believe the market should be valued higher!  Personally I don’t believe that is right but what I think or feel has no bearing on what is occurring.  Trade the chart as it is not as you think it should be because the market doesn’t care what you think.  Could this turn out to be an irrational rally?  Yes, it could but it could also just keep going up.  Focus on price action and it will lead the way.

Trade Wisely,

Doug

CRON Up 32.7%

💲 Thank you for reading our blog! Yesterday I posted about CRON and that we were stalking CRON for a trade. We bought CRON soon after the open and when the market closed our 😎 CRON trade was up 32.7%. 👀 The LTA Live Trading Alert Scanner and the Hit and Run family is the best of the best. All buys and closes announced in HRC Live Trading Room, be sure to tune in starting at 9:10 Eastern when I’ll review the markets, trade ideas.

👀 The SPY closed another 1.32% and above the 50-SMA, the 5th day for higher lows and higher highs. In a yesterdays blog post I had written the close is what counts” and over $289.20 would be amazing, well the high was over $289.20, but the close was below and yesterday’s candle was a Shooting Star, A Shooting Star at resistance and after being up five days in a row.  Could the Shouting Star be a warning sign for a little profit taking within a day or two? And let’s think about the 50-SMA, the price has closed and rallied above the 50-SMA without a test as of yet. The only thing I can say is “don’t run with scissors” The VXX is hanging out near a support line, but the price did not close like there was much fear, perhaps the fear comes in a day or two.

👉 CRON popped for us closing up 32.7% in the first day. We will manage the trade based on our rules and what we teach in the trading room.👇

🎯 CZR is another chart we are stalking this week on our watchlist; The weekly chart has constructed a bottom followed by a Bullish Engulf and follow-through over $9.65 with a qualified chart pattern we could be tempted. CZR alerted yesterday on the

#1 Tool in my toolbox “The LTA Live Trading Alert Scanner? Members are sure to be in the trading room about 9:10 Eastern when I review the markets, trade ideas, and CZR. WYNN, KMX, QCOM, ARCC, AIG, ROKU, SMAR are also on our list.

✅ A Traders Edge In All Markets

The LTA Scanner can filter out charts that are trending, up or down and alert on charts that have Candlestick signals and patterns, western patterns and when indicators, such as MACD, Stochastics, RSI or Bollinger Bands have crossed or reaches the desired level. Hey, check out the NEW BULL PERFECT TREND ALERT. The right tools for the job.

Acton Plan

  1. ✅ Trade smart and think about price action
  2. Use our base hit strategy, sell into strength
  3. Buy close to your stop and support
  4. USE the LTA Trade Alert Scanner to find the winners

We use 2 of The Worlds Best Trading Tools, TC2000 for charting, LTA-Live Trading Alerts for real-time price action, candle and candle patterns, and western patterns. The right tools for the right job.👍

Free YouTube Education  •  Subscription PlansPrivate 2-Hour Coaching

DISCLAIMER: Investing / Trading involves significant financial risk and is not suitable for everyone. No communication from Hit and Run Candlesticks Inc, its affiliates or representatives is not financial or trading advice. All information provided by Hit and Run Candlesticks Inc, its affiliates and representatives are intended for educational purposes only. You are advised to test any new trading approach before implementing it.  Past performance does not guarantee future results.  Terms of Service

Massive reversal of sentiment.

Massive reversal

What a massive reversal of market sentiment as the bulls find even more energy to extend this incredible relief rally.  Is this irrational exuberance? Perhaps, but it would be very unwise to try and fight it or predict when it will be over.  Remember the market can remain irrational much longer than you can remain liquid if you try to fight the bull. 

Asian markets closed higher on better than expected trade surplus numbers.  European markets are bullish but subdued ahead of UK economic data this morning.  US Futures point to more than a 100 point Dow gap after avoiding tariff increases with Mexico and news of a huge merger between United Technologies and Raytheon creating the 2nd largest defense company in the world.  If your long this morning remember gap are gifts taking profits or scaling.  Never allow greed to get in the way of taking a profit.  If you miss this rally then for goodness sake don’t chase it this late in the move with the fear of missing out.  Stay disciplined and exercise patience waiting for the next entry.

On the Calendar

calendar

On the Earnings Calendar we have about 30 companies reporting their quarterly results today with none that are particularly notable unless you happen to own one of them.  Make sure always to check earnings dates a part of your market preparation.

Action Plan

A deal with Mexico to avert tariffs, a larger than expected China trade surplus and a merger or United Technologies and Raytheon continue to inspire the bulls higher this morning.  US futures are suggesting more than a 100 point gap in an already very extended relief rally even as the president expresses the willingness to add 300 billion in Chinese tariffs.  Is this over-exuberance and a bit nonsensical?  Maybe, but as a retail trader it’s unwise to fight the bull or try to predict its conclusion because they can run right over you.

While I feel this relief rally is very extended and this mornings gap has the potential to end as a pop an drop I must stay focused on the price action trading what is not what I think it should be.  As Jessie Livermore once said, “The Market is never wrong but opinions often are”.  Stay disciplined to your rules taking profits or scaling out not allowing greed to interfere with taking profits.  Remember gaps are gifts!  If you have missed this rally then for goodness sake don’t chase it with the fear of missing out.  Be patient and wait for the next entry based on good price action and analysis rather than emotion.

Trade Wisely,

Doug

Profits On MCD

💲 Another great day this past Friday closed out the last ½ of MCD for a 50.9% base hit or $410.00. Knowing how to make sense of a chart, the LTA Live Trading Alert Scanner and the Hit and Run family is the best of the best. All buys and closes announced in HRC Live Trading Room, be sure to tune in starting at 9:10 Eastern when I’ll review the markets, trade ideas.

👀 The Bull did it’s a thing again on Friday, gapping and closing above the 50-SMA followed by four higher closes (AMAZING). We have added a resistance line because of the multiple touches between the buys and sellers at $289.20. There is no question the 👈Bulls have had a great run, and we may even see more of it today, the close is what will count. Over the 50-SMA was major and the bull deserves a rest but not required. A close over $289.20 would be another amazing day, and unfortunately, the FOMO (Fear of Missing Out) sickness will hit many swing traders, let’s not forget the 3-day rule, plan your trades and wait for the trap to work. Price in the VXX 15-Min chart is still trading below the T-Line Red Dots, and the FNGU 15-Min chart is trading above the T-Line Green Dots. At Friday’s close.

👉Bought MCD on June 4th, July 19 $125.00 Calls. Closed on June 7, for a 💲 50% profit. 😎 I’ll take a Big Mac, Fries, and a Coke, please.

🎯 CRON is one we are stalking this week on our watchlist; If you look at a 3-day chart, you can see the Double Bottom and Bullish Engulf. We are bullish on CRON over $16.00 with a qualified chart pattern. CRON alerted a couple of times last week on the #1 Tool in my toolbox “The LTA Live Trading Alert Scanner? Members are sure to be in the trading room about 9:10 Eastern when I review the markets, trade ideas, and CRON.

Download TC2000 and trade t the T-Line T-Bands, Red/Green Trendicator

A Traders Edge In All Markets

The LTA Scanner can filter out charts that are trending, up or down and alert on charts that have Candlestick signals and patterns, western patterns and when indicators, such as MACD, Stochastics, RSI or Bollinger Bands have crossed or reaches the desired level. Hey, check out the NEW BULL PERFECT TREND ALERT. The right tools for the job.

Acton Plan

  1. Don’t fall into the (FOMO) trap: The Fear of Missing Out
  2. Use our base hit strategy, sell into strength
  3. Buy close to your stop and support
  4. USE the LTA Trade Alert Scanner to find the winners

We use 2 of The Worlds Best Trading Tools, TC2000 for charting, LTA-Live Trading Alerts for real-time price action, candle and candle patterns, and western patterns. The right tools for the right job.👍

Free YouTube Education  •  Subscription PlansPrivate 2-Hour Coaching

DISCLAIMER: Investing / Trading involves significant financial risk and is not suitable for everyone. No communication from Hit and Run Candlesticks Inc, its affiliates or representatives is not financial or trading advice. All information provided by Hit and Run Candlesticks Inc, its affiliates and representatives are intended for educational purposes only. You are advised to test any new trading approach before implementing it.  Past performance does not guarantee future results.  Terms of Service

Light at the end of the tunnel?

Light at the end of the tunnel

There may be some light at the end of the tunnel this morning with news Mexico has made concessions that could avert the 5% tariff increase on Monday.  That would be a welcomed relief and the US futures point to a bullish open ahead of the Employment Situation report.  Asian market closed mixed overnight but European indexes are green across the board this morning. 

With possible interest rate cuts in the signaled by the Fed the 8:30 AM Eastern Employment Situation report could create a significant price reaction upon its release.  If you’re rooting for a rate decrease a miss of the 180K consensus estimate is likely to help Fed or even speed up their action.  A strong jobs number could impede or slow the FOMC decision and receive a negative market reaction.  No matter what happens consider the risk carefully you carry into the weekend after such a steep market rally.

On the Calendar

calendar

We have a light day on the Earnings Calendar with only 16 companies reporting.  Looking through those set to report but none are particularly notable.

Action Plan

According to reports Mexico has made concessions that may avert the 5% increase in Tariffs scheduled for June 10th.  If true that is very good news for US car manufacturers and a welcome relief to the overall market.  US Futures are once again looking to extend the relief rally that has recovered more than 900 Dow points in just three days so far. 

Of course the Employment Situation report at 8:30 AM Eastern will have something to say about how the market opens today.  If the number comes in less then the 180k consensus estimates the market may see that as good news supporting the idea of lowered interest rates in September.  Should the number come in strong the market may see that negatively as it works against the hoped-for rate cut.  One thing is certain this will be a heavily watched report that may inspire a significant market reaction upon its release.  Having seen such a steep rally this week consider the weekend risk as you plan your day.  Have a great weekend everyone.

Trade Wisely,

Doug

Friday SPY Nearing 50-SMA

💲 Yesterday 6/6/19 we closed AMD for an 89% win and SNAP for 82% win. AIG has a small gain and MCD we are holding at an 18% gain; we did close ½ MCD yesterday near the close (love the base hits). All buys and closes are announced in HRC Live Trading Room, Be sure to tune in starting at 9:10 Eastern when I’ll review the markets, trade ideas.

Another fine day in the market for Thursday even with the nail biters waiting for the Friday Jobs number. Good or bad? Your guess is a good as mine; we will know after the blog is posted. The SPY weekly chart has printed a near Bullish Engulf. Follow through over $284.80, challenge and win the pin of the 50-day SMA would suggest the bulls are back in town. Anything short of closing over the 50-SMA or a weak candle by the end of the day would but a possible Blue Ice Failure on the table. With as much as the SPY has rallied, you would think a little profit taking would be in order. The VXX pre-market is not giving any clues just yet, and the FNGU (FANG) chart is showing a nice little gap, so much can happen in a day of trading.

👉 The two charts below 👇 are AMD and SNAP both closed yesterday for 89% and 82%. I thought you might find them educational and helpful; please feel free to ask questions about them in the trading room if you like.

🎯 It’s Friday, and I don’t post trade ideas on Friday, but we do cover trades and the market in the trading room starting at 9:10 am “The LTA Live Trading Alert Scanner, and TC2000 are my #1 tools I trade with? Members, be sure to be in the trading room about 👉9:10 Eastern when I review the markets, and your trade ideas.

Download TC2000 and trade t the T-Line T-Bands, Red/Green Trendicator

A Traders Edge In All Markets

The LTA Scanner can filter out charts that are trending, up or down and alert on charts that have Candlestick signals and patterns, western patterns and when indicators, such as MACD, Stochastics, RSI or Bollinger Bands have crossed or reaches the desired level. Hey, check out the NEW BULL PERFECT TREND ALERT. The right tools for the job.

6/7/2019 Acton Plan

  1. Friday is payday, clean up the dead wood and count your money
  2. Use our base hit strategy, sell into strength
  3. Grow rich trading base hits
  4. USE the LTA Trade Alert Scanner to find the winners

We use 2 of The Worlds Best Trading Tools, TC2000 for charting, LTA-Live Trading Alerts for real-time price action, candle and candle patterns, and western patterns. The right tools for the right job.👍

Free YouTube Education  •  Subscription PlansPrivate 2-Hour Coaching

DISCLAIMER: Investing / Trading involves significant financial risk and is not suitable for everyone. No communication from Hit and Run Candlesticks Inc, its affiliates or representatives is not financial or trading advice. All information provided by Hit and Run Candlesticks Inc, its affiliates and representatives are intended for educational purposes only. You are advised to test any new trading approach before implementing it.  Past performance does not guarantee future results.  Terms of Service

Overextended?

The extraordinary rally is a welcome relief but not one must wonder if the exuberance of the potential interest rate cut is now overextended.  One thing for sure is that we have moved a long way in a very short period of time and a little pullback would not be out of the question.  Be careful not to chase.  Asian market closed mixed but mostly modestly lower overnight.  European markets are currently green across the board as they await an ECB rate decision.

With the DIA, SPY and QQQ back above their respective 200-day averages repairing some of the technical damage in the charts but that will only be true if the bulls can prove to hold them as support.  We have the big Employment Situation number Friday morning so don’t rule out the possibility of light and choppy price action after the morning rush as we wait.  Remember some profit taking could begin at any time with the Dow having risen more than 700 points in just two days.

On the Calendar

calendar

We have fewer than 30 companies reporting quarterly results today.  Notable reports include OllI & SIG.

Action Plan

After two big days of rally on the hope of an interest rate cut futures are once pointing to a modestly bullish gap up open.  However that could certainly increase or decline as we move toward the open with International Trade, Jobless Claims, as well as Productivity & Cost numbers at 8:30 AM Eastern.  It will be interesting to see if the bull can maintain their enthusiasm after Goldman’s warning that the market has overpriced the possible Fed cuts. 

This morning we are also waiting on an ECB rate decision.  A surprise cut or increase across the pond has in the past moved US markets significantly in the past so keep an eye on those early morning futures.  Although the indexes are still well below their 50-day moving averages the DIA, SPY and QQQ have pop above their 200-averages reliving some of the technical damage.  If some profit takers do soon come in holding above these key averages will be very important.  Remember we have the Employment Situation number Friday morning so after the morning rush don’t be surprised to light and choppy price action as wait.

Trade Wisely,

Doug

AIG Morning Star Sweet Spot

Yesterday 6/5/19 we closed BABA for a small loss and 💲 closed KO for 50% profit a good day all in all AIG, AMD, and SNAP held well into yesterdays close. We will monitor them carefully. We also picked up a little MCD near the close yesterday. All buys and closes are announced in HRC Live Trading Room Be sure to tune in starting at 9:10 Eastern when I’ll review the markets, trade ideas.

The SPY had another Bullish day yesterday trying to defy gravity (don’t bet on that for too long we are very overextended) We had a target line drawn for the SPY and missed it by .01. The number for the bulls to beat now is $284.20, followed by a $285.70. I would expect a little profit taking and backfilling before these numbers can be challenged. On a profit-taking pullback, I will be using $278.90 as support. The VXX is a little active this morning, and I did discuss the VXX and the intraday candles yesterday near the close in the HRC Trading Room.

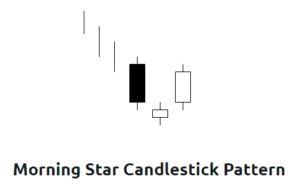
🎯 AIG is one we are stalking today on our watchlist; we already own the August 50.00 Calls and would like to add to the position. AIG is currently sitting in the T-Line Band Sweet Spot following a bullish Morning Star Signal. AIG also has been alerting on the #1 Tool in my toolbox “The LTA Live Trading Alert Scanner?

Members, be sure to be in the trading room about 9:10 Eastern when I review the markets, trade ideas, and AIG, SPWR, ROKU, SHOP, OKTA, CSX, HON, SNAP, CRON

A Traders Edge In All Markets

The LTA Scanner can filter out charts that are trending, up or down and alert on charts that have Candlestick signals and patterns, western patterns and when indicators, such as MACD, Stochastics, RSI or Bollinger Bands have crossed or reaches the desired level. Hey, check out the NEW BULL PERFECT TREND ALERT. The right tools for the job.

6/6/2019 Acton Plan

  1. Monitor the VXX for signs of fear
  2. Use our base hit strategy, sell into strength
  3. Grow rich trading base hits
  4. USE the LTA Trade Alert Scanner to find the winners

We use 2 of The Worlds Best Trading Tools, TC2000 for charting, LTA-Live Trading Alerts for real-time price action, candle and candle patterns, and western patterns. The right tools for the right job.👍

Free YouTube Education  •  Subscription PlansPrivate 2-Hour Coaching

DISCLAIMER: Investing / Trading involves significant financial risk and is not suitable for everyone. No communication from Hit and Run Candlesticks Inc, its affiliates or representatives is not financial or trading advice. All information provided by Hit and Run Candlesticks Inc, its affiliates and representatives are intended for educational purposes only. You are advised to test any new trading approach before implementing it.  Past performance does not guarantee future results.  Terms of Service