Oil Event Causes Ripple

✅ At hit and Run Candlesticks, we focus on Stocks / Simple Directional Options
The market (SPY), Yesterday was a tremendous money-making day in the market, all thanks to the LTA Scanner and a few critical indicators on our charts. The SPY is on a beautiful T-Line Run, and it will last until it doesn’t, watch price action. Price action over the past ten days has gone from below the T-Bands to above the T-Bands, a bullish move for the buyers. Let’s keep our eyes on the $302.23 high and the price staying above the T-Line. Any changes we will post an update.
✅ SMS text alerts and reminders?👈

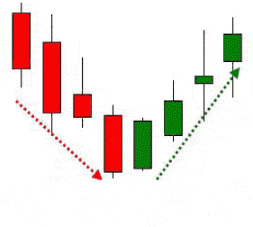
Bullish Cup
and Handle Pattern: The
“cup and handle formation” is a bullish signal pointing to a continuation of
the current trend. It may extend over several weeks or even months and contains
specific attributes.
As with any continuation pattern, you rely on confirmation in
one form or another. This may occur as a second technical price signal, a
candlestick continuation, volume spike, or change in momentum.
There are several parts to the cup and handle. First is the
cup, which is a rounded bottom extending over time. As the shape of the cup is
completed, expect the handle to emerge. This is a swing trade in the opposite
direction, characterized by a specific channel between resistance and support,
forming as a pennant or similar channel movement and, quite often, separated
from the “cup” with an upside
gap. As the handle declines and concludes, price reverses, moving again to the
upside and setting up as a breakout from previous resistance. Read More
The I path Series S&P 500 VXX Short Term Futures ETN. The VXX is looking at a bounce today with the oil situation. The VXX is already in a 13-Min premarket (RBB) Pattern. Above @23.60 the VXX could get to the 34-EMA and the 5-SMA on the daily chart.
Trade-Ideas
For Your Consideration: Here are a few tickers we will be adding to our swing trade watch-list. PGC, NVAX, XEC, AXSM, WB, MCD, SBUX, SHOP Trade smart, and trade your trade. Stocks we mention and talk about are not recommendations to buy or sell
😊 Have a great trading day – Rick
✅ Check out our newest YouTube videos👈


🎯 Mike Probst: Rick, Got CTL off the scanner today. Already up 30%. Love it.
🎯 Dick Carp: the scanner paid for the year with HES-thank you
🎯 Arnoldo Bolanos: LTA scanner really works $$, thanks Ed.
🎯 Bob S: LTA is incredible…. I use it … would not trade without it
🎯 Malcolm .: Posted in room 2, @Rick… I used the LTA Scanner to go through hundreds of stocks this weekend and picked out three to trade: PYPL, TGT, and ZS. Quality patterns and with my trading, up 24%, 7% and 12%…. this program is gold.
🎯 Friday 6/21/19 (10:09 am) Aaron B: Today, my account is at +190% since January. Thanks, RWO HRC Flash Malcolm Thomas Steve Ed Bob S Bob C Mike P and everyone that contributes every day. I love our job.
Disclosure: We do not act on all trades we mention, and not all mentions acted on the day of the mention. All trades we mention are for your consideration only.
Free YouTube Education • Subscription Plans • Private 2-Hour Coaching
DISCLAIMER: Investing / Trading involves significant financial risk and is not suitable for everyone. No communication from Hit and Run Candlesticks Inc, its affiliates or representatives is not financial or trading advice. All information provided by Hit and Run Candlesticks Inc, its affiliates and representatives are intended for educational purposes only. You are advised to test any new trading approach before implementing it. Past performance does not guarantee future results. Terms of Service


