
Do you have an umbrella handy? When dark clouds are on the horizon, you know that a downpour could soon be on the way. Similarly, when you spot the Dark Cloud Cover pattern on a Japanese candlestick chart, you need to anticipate the arrival of a bearish reversal. This candlestick pattern is somewhat easy to spot because its formation clearly reflects its name: at the end of an uptrend (i.e., a sunny day), a black candle appears (a “dark cloud”), heralding a reversal. Let’s learn a little more about this ominous signal . . .
Dark Cloud Cover Pattern
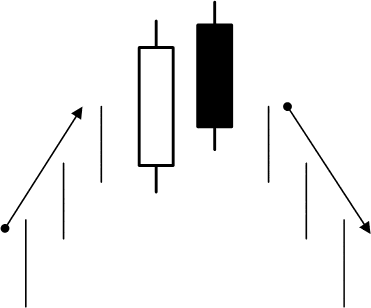
Formation
The Dark Cloud Cover pattern is the opposite of the Piercing candlestick pattern (which is a bullish reversal signal). To identify it, several conditions must be met:
First, a definite uptrend must be occurring. Second, a negative candle (which can be black or red) must follow a positive candle (which can be white or green). Third, the black candle must pass through the midpoint of the previous day’s candle. It must open above the high of the previous day, and it must close more than halfway down the body of the previous day. Fourth and finally, to confirm the pattern’s presence, the following day’s price must continue to drop and close lower.
Meaning
The implications of the Dark Cloud Cover pattern can be summed up by imagining a dark cloud overtaking the sky on a bright, sunny day.
When you spot a Dark Cloud Cover pattern, you know by the obvious uptrend that the bulls were in control. The bulls continue to push forward after the open, and the price gaps up, but then the bears step in. The price closes near the low of the day, and the uptrend ends. If the bears continue to control the market on the following day, a reversal is likely.
To better understand the story behind the specific Dark Cloud Cover pattern that you spot, look for these characteristics:
- The higher the gap up is from the previous day’s close, the bigger the reversal will be. This shows that the market was unable to sustain that high price level.
- The longer the white candle and black candle are, the more pronounced the reversal will be.
- The lower the black candle closes into the white candle, the stronger the reversal will be.
- If the volume is high on both days, the reversal is more likely to occur.
– – – – –
If you think you’ve spotted a Dark Cloud Cover pattern, take a moment to ensure that you haven’t actually seen a Bearish Engulfing pattern. They’re very similar in appearance. If the second candle closes below the previous day’s open, you have a Bearish Engulfing pattern, not a Dark Cloud Cover pattern. Identification is essential to understanding and reacting to these helpful candlestick patterns, so take your time and don’t make rash decisions. Good luck!
If you’re interested in mastering some simple but effective swing trading strategies, check out Hit & Run Candlesticks. Our methods are simple, yet powerful. We look for stocks positioned to make an unusually large percentage move, using high percentage profit patterns as well as powerful Japanese Candlesticks. Our services include coaching with experienced swing traders, training clinics, and daily trading ideas. To sign up for a membership, please click here.


Comments are closed.