
INAP – Printed A Bullish Harami On Support
 INAP – Printed a Bullish Harami on support after a breakout run then a pullback creating a PBO (Pull Back Opportunity). Major moving averages such as the 20-SMA , 34-ema, 50-SMA are rising with price. On a 5-day chart, INAP is a Rounded Bottom Breakout consolidating on the Dotted Deuce line.
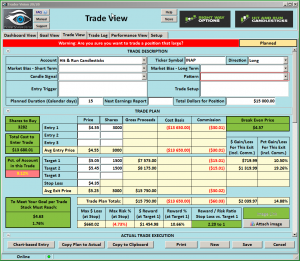
Good Trading – Hit and Run Candlesticks
Learn more about Hit and Run Candlesticks, and today’s trade idea and plan plus the 10 or more members trade ideas, starting at 9:10 EST AM every morning. Every day we teach and trade using the T-Line, Candlesticks, Support and Resistance, Trends, chart patterns and continuation patterns.
Trade Updates – Hit and Run Candlesticks
No new trades yesterday BUT we did close ½ of the SGMO position for a 24.43% gain.
Are you having trouble putting together a winning trade? Not sure what scans to use? So near to having multiple winning trades, but something always goes wrong. Maybe a couple hours with a trading coach could make all the difference in the world. Hit and Run Candlesticks has 4 trading coaches – Learn More about the Coaches
With on-demand recorded webinars, eBooks, and videos, member and non-member eLearning, plus the Live Trading Rooms, there is no end your trading education here at the Hit and Run Candlesticks, Right Way Options, Strategic Swing Trade Service and Trader Vision.
► HIIQ is up 51.83$% from our members post on May 31. Hit and Run Candlesticks members practice trade management and trade planning with Price and Candlesticks, The T-line, Trend, Trend Lines, Support, and Resistance.
Eyes On The Market (SPY)
The Bulls proudly bounced back yesterday closing back over the T-Line printing a Bullish Harami on the 2-day chart. Price also closed headed into resistance and $247.25 may cause the Bull a little grief. A good Bull chart would be a pullback to a higher low than a breakout out of the previous high.
What is a Trade Idea Watch-list?
A trade idea watchlist is a list of stocks that we feel will move in our desired direction over a swing trader’s time frame. That time could be one to 15 days for example. From that watch list, we wait until price action meets our conditions for a trade.
Rick’s personal trade ideas for the day MEMBERS ONLY
Start your education with wealth and the rewards of a Swing Traders Life – Click Here
Investing and Trading involve significant financial risk and are not suitable for everyone. No communication from Hit and Run Candlesticks Inc. is financial or trading advice. All information is intended for Educational Purposes Only. Terms of Service.
Rick Saddler is not a licensed financial adviser nor does he offer trade recommendations or advice to anyone except for the trading desk of Hit and Run Candlesticks Inc.


Comments are closed.