SPY Is Range Bound Near It’s 23.3 Fibonacci Retracement Line
(SPY) The SPY is range bound near it’s 23.3 Fibonacci retracement line. 4 out of 5 candlesticks closed below the T-Line last week while all 5 of last weeks candlesticks closed above the 23.6% Fib. Line. The Bearish Engulf on the 3-day chart still weighs heavy on the next 2 following candles, they both have closed below $243.50 and the Bearish Engulf 50% line. The Bulls need to challenge and win the $243.50 line to put a new high challenge together.
Free Trade Idea – IPI
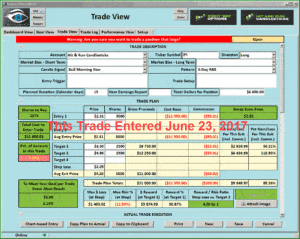 IPI (Intrepid Potash Inc.) Was first a members trade idea on May 16, 2017, and as of Friday’s close up 10%. On the monthly chart, I see support above the bottom construction. On a 3-day chart, IPI is An RBB pattern with a Bullish Engulf on the Dotted Deuce.
With on-demand recorded webinars, eBooks, and videos, member and non-member eLearning, plus the Live Trading Rooms, there is no end your trading education here at the Hit and Run Candlestick, Right Way Option, Strategic Swing Trade Service and Trader Vision.
Conditions For The IPI Trade
- RBB setup 3-day chart
- Bullish Morning Star Daily
- Trending
- Big Three Engulf
- Swing or swings: 30% Plus
From our Members Watchlist
PI is up another 42.97% from our members only post on May 8, 2017; PI popped 7.58% Friday with a breakout, flag, breakout. Know how to get aboard a trending stock is an art that can be learned, something we teach every day in the trading room
Hit and Run Candlesticks Movers – SPY VS Members List Last 7 Bars
- IMGN +33.77%
- CARA +32.30%
- VRX +30.36%
What is a Trade Idea Watchlist?
A trade idea watchlist is a list of stocks that we feel will move in our desired direction over a swing trader’s time frame. That time could be one to 15 days for example. From that watchlist, we wait until price action meets our conditions for a trade.
MEMBERS ONLY
Investing and Trading involve significant financial risk and are not suitable for everyone. No communication from Hit and Run Candlesticks Inc. is financial or trading advice. All information is intended for Educational Purposes Only. Terms of Service.
Rick Saddler is not a licensed financial adviser nor does he offer trade recommendations or advice to anyone except for the trading desk of Hit and Run Candlesticks Inc.
Sellers Were Able To Keep The Ball Below The Upper Bullish T-Line Band
(SPY) The sellers were able to keep the ball below the upper Bullish T-Line Band, and the buyers were able to the ball above the lower Bearish T-Line Band. The short term battle is heating up between the Bulls and Bears with a winner trying to emerge, (we know from experience it’s the short term battles that lead to the longer term win). The Bearish Engulf on the 3-day chart still has the Bull under pursuer for the short term, if the Bearish Engulf can drive price below $242.63 June, 16 low is support for the Bears will have taken a minor point. Overall in the big picture, we remain Bullish
It’s Friday – No Trade Idea
Here at Hit and Run Candlesticks, we feel it’s important to slow things down on Fridays, take profits, reflect on your weeks trading, (winners and losers). How and what can we do to improve.
With on-demand recorded webinars, eBooks, and videos, member and non-member eLearning, plus the Live Trading Rooms, there is no end your trading education here at the Hit and Run Candlestick, Right Way Option, Strategic Swing Trade Service and Trader Vision.
Topic Charts For Members Yesterday
Why Trade With Hit and Run Candlesticks
VRX is up 60.46% from our members only post on May 2, 2017; and a nice %13.30 move yesterday, we banked ½ the profits.
Hit and Run Candlesticks Movers Yesterday
- VRX 13.30%
- SPWR 13.15%
- SGMO 12.88%
[button_1 text=”We%20Guarantee%20To%20Post%2010%20Trades%20That%20Will%20Profit%20Over%2010%25%20″ text_size=”32″ text_color=”#000000″ text_bold=”Y” text_letter_spacing=”0″ subtext_panel=”Y” subtext=”3-Month%20Trial%20Only%20%24212.50″ subtext_size=”20″ subtext_color=”#ea0606″ subtext_bold=”Y” subtext_letter_spacing=”0″ text_shadow_panel=”N” styling_width=”40″ styling_height=”30″ styling_border_color=”#000000″ styling_border_size=”1″ styling_border_radius=”6″ styling_border_opacity=”100″ styling_shine=”Y” styling_gradient_start_color=”#ffff00″ styling_gradient_end_color=”#ffa035″ drop_shadow_panel=”N” inset_shadow_panel=”N” align=”center” href=”https://ob124.infusionsoft.com/app/orderForms/Membership—Hit-and-Run-Candlesticks—Quarterly” new_window=”Y”/]
What is a Trade Idea Watchlist?
A trade idea watchlist is a list of stocks that we feel will move in our desired direction over a swing trader’s time frame. That time could be one to 15 days for example. From that watchlist, we wait until price action meets our conditions for a trade.
MEMBERS ONLY
Investing and Trading involve significant financial risk and are not suitable for everyone. No communication from Hit and Run Candlesticks Inc. is financial or trading advice. All information is intended for Educational Purposes Only. Terms of Service.
Rick Saddler is not a licensed financial adviser nor does he offer trade recommendations or advice to anyone except for the trading desk of Hit and Run Candlesticks Inc.
The SPY Has Been Under A Little Pressure
(SPY) The SPY has been under a little pressure the last few trading days after making an all-time high. The Bulls still have the upper hand as long as they can maintain control of the $241.63 support area. The Bearish Engulf on the 3-day chart is still a problem the Bulls need to confront.
Free Trade Idea – IMGN
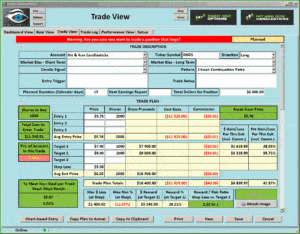 IMGN (Immunogen Inc) Was first a members trade idea on Januar 4, 2017 and as of yesterday’s close is up 189.42%. On a 3-day chart, IMGN is headed for the 200-sma, and I believe more.
With on-demand recorded webinars, eBooks, and videos, member and non-member eLearning, plus the Live Trading Rooms, there is no end your trading education here at the Hit and Run Candlestick, Right Way Option, Strategic Swing Trade Service and Trader Vision.
Conditions For The IMGN Trade
- RBB setup 3-day chart
- Flag PBO
- Bullish J-Hook set up
- T-Line Bounce
- Swing or swings: 30% Plus
Why Trade With Hit and Run Candlesticks
DVAX is up 107.78% from our members only post on March 1, 2017; DVAX popped another 5.65% yesterday with a beautiful T-Line Run.
Hit and Run Candlesticks Movers Yesterday
- IMGN +11.07%
- NVCR 9.72%
- RHT 9.58%
[button_1 text=”Try%203-Months%20With%20Hit%20and%20Run%20Candlesticks” text_size=”32″ text_color=”#000000″ text_bold=”Y” text_letter_spacing=”0″ subtext_panel=”Y” subtext=”Guaranteed%2010%20trades%20over%2010%25″ subtext_size=”15″ subtext_color=”#f71818″ subtext_bold=”Y” subtext_letter_spacing=”0″ text_shadow_panel=”N” styling_width=”40″ styling_height=”30″ styling_border_color=”#000000″ styling_border_size=”1″ styling_border_radius=”6″ styling_border_opacity=”100″ styling_shine=”Y” styling_gradient_start_color=”#ffff00″ styling_gradient_end_color=”#ffa035″ drop_shadow_panel=”N” inset_shadow_panel=”N” align=”center” href=”https://ob124.infusionsoft.com/app/orderForms/Membership—Hit-and-Run-Candlesticks—Quarterly” new_window=”Y”/]
What is a Trade Idea Watchlist?
A trade idea watchlist is a list of stocks that we feel will move in our desired direction over a swing trader’s time frame. That time could be one to 15 days for example. From that watchlist, we wait until price action meets our conditions for a trade.
MEMBERS ONLY
Investing and Trading involve significant financial risk and are not suitable for everyone. No communication from Hit and Run Candlesticks Inc. is financial or trading advice. All information is intended for Educational Purposes Only. Terms of Service.
Rick Saddler is not a licensed financial adviser nor does he offer trade recommendations or advice to anyone except for the trading desk of Hit and Run Candlesticks Inc.
Trading In The Direction Of The Market
(SPY) The profitable swing trader has discovered trading in the direction of the market is easier and more profitable. I believe this is something that will never change. The buyers continue to dominate the overall market with periods of consolidation and minor pullbacks which turn out to be buying opportunities.
The SPY is currently working on a Hammer / Bull Kicker and a rising 34-EMA. A close over $244.87 in the next few days would set up the SPY for another Bullish leg.
Free Trade Idea – SWIR
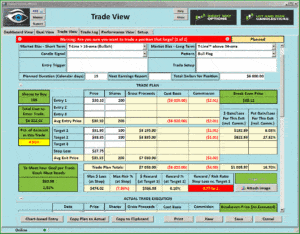 SWIR (Sierra Wireless Inc.) Has started a bullish rise from the May 5 gap, over the past few days SWIR has formed a flag pull back. We feel this could be a opportunity before the breakout of the recent high.
With on-demand recorded webinars, eBooks, and videos, member and non-member eLearning, plus the Live Trading Rooms, there is no end your trading education here at the Hit and Run Candlestick, Right Way Option, Strategic Swing Trade Service and Trader Vision.
Conditions For The SWIR Trade
- Bullish gap
- Flag PBO
- Bullish J-Hook set up
- Bullish Engulf
- Swing or swings: 25% Plus
Why Trade With Hit and Run Candlesticks
WYNN is up 32.21% from our members only post on March 15, 2017; WYNN was another 3% yesterday on a breakout headed to our higher targets.
Email us back and let us know why your not a member and you could win a $20.00 gift card to Amazon. Will will be giving 5 Amazon gift cards away.
Hit and Run Candlesticks Movers Yesterday
- IMGN +7.21%
- CONN +6.67%
- NVCR +6.76%
What is a Trade Idea Watchlist?
A trade idea watchlist is a list of stocks that we feel will move in our desired direction over a swing trader’s time frame. That time could be one to 15 days for example. From that watchlist, we wait until price action meets our conditions for a trade.
MEMBERS ONLY
Investing and Trading involve significant financial risk and are not suitable for everyone. No communication from Hit and Run Candlesticks Inc. is financial or trading advice. All information is intended for Educational Purposes Only. Terms of Service.
Rick Saddler is not a licensed financial adviser nor does he offer trade recommendations or advice to anyone except for the trading desk of Hit and Run Candlesticks Inc.
Bulls Were Able To Close Price With A Hammer Keeping Them Above Water
(SPY) Friday cracked our $241.90 line, but the Bulls were able to close price with a Hammer keeping them above water. I think we all should be aware that the 3-day chart on the SPY is supporting a Bearish Engulf, which means the Bulls needs to reclaim $244.10. Many Bullish charts remain intact and look strong with the normal pause and a routine break. A key to successful swing trading is knowing when to be patient and how to manage a chart.
Free Trade Idea – HIIQ
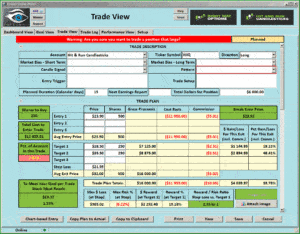 HIIQ (Health Insurance Innovations) Broke out Friday on a Bullish Morning Star Signal. Up to the Morning Star signal, HIIQ has seen a bullish run with a pullback to the 34-ema.
With on-demand recorded webinars, eBooks, and videos, member and non-member eLearning, plus the Live Trading Rooms, there is no end your trading education here at the Hit and Run Candlestick, Right Way Option, Strategic Swing Trade Service and Trader Vision.
Conditions For The HIIQ Trade
- Higher Lows and Higher Highs
- Bullish J-Hook set up
- 3-Day Morning Star
- Swing or swings: 25% Plus
Why Trade With Hit and Run Candlesticks
DVAX is up 74.44% from our members only post on March 1, 2017, and it’s on our member’s trade idealist today. Tell us why your not a Subscriber and you could win!
E-Mail Us Here
Email us back and let us know why your not a member and you could win a $20.00 gift card to Amazon. Will will be giving 5 Amazon gift cards away.
Hit and Run Candlesticks Movers Friday
- PI +19.11%
- HIIQ +12.90%
- VHC +10.11%
What is a Trade Idea Watchlist?
A trade idea watchlist is a list of stocks that we feel will move in our desired direction over a swing trader’s time frame. That time could be one to 15 days for example. From that watchlist, we wait until price action meets our conditions for a trade.
MEMBERS ONLY
Investing and Trading involve significant financial risk and are not suitable for everyone. No communication from Hit and Run Candlesticks Inc. is financial or trading advice. All information is intended for Educational Purposes Only. Terms of Service.
Rick Saddler is not a licensed financial adviser nor does he offer trade recommendations or advice to anyone except for the trading desk of Hit and Run Candlesticks Inc.
Don’t Fall For The “Yellen” Knee Jerk Today
(SPY) Today could be a game changer, or just more of the same just don’t fall for the “Yellen” knee jerk today. We at Hit and Run Candlesticks have always found it better to be patient and follow the charts. Never could understand why traders continue to front run and guess what will happen. Currently, the Bulls are in control over about $241.90 on the SPY, under could be a different story.
Free Trade Idea – HDP
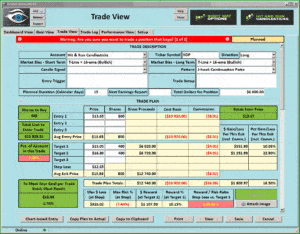 HDP (Hortonworks Inc) Gapped and broke out on May 5th ran a bit and then stared to see profit taking. HDP looks have found support near the 34-ena and the 50-sma. A Bullish Morning Star lead to a breakout of the T-Line. Over $13.60 we see a possible 20%
With on-demand recorded webinars, eBooks, and videos, member and non-member eLearning, plus the Live Trading Rooms, there is no end your trading education here at the Hit and Run Candlestick, Right Way Option, Strategic Swing Trade Service and Trader Vision.
Conditions For The HDP Trade
- Higher Lows and Higher Highs
- 2 and 3 day J-Hook setting up
- Trending
- Bullish Engulf (5 day chart)
- Swing or swings: 20% Plus
Why Trade With Hit and Run Candlesticks
OMER is up 23.46% from our members only post on April 4, 2017 and up 14% yesterday. Tell us why your not with us and you could win.
[button_1 text=”Tell%20US%20Why%20Your%20Not%20A%20Member%20And%20You%20Could%20Win%20A%20%2420.00%20Amazon%20Gift%20Card” text_size=”32″ text_color=”#000000″ text_bold=”Y” text_letter_spacing=”0″ subtext_panel=”Y” subtext=”Click%20Here” subtext_size=”15″ subtext_color=”#f54242″ subtext_bold=”Y” subtext_letter_spacing=”0″ text_shadow_panel=”N” styling_width=”40″ styling_height=”30″ styling_border_color=”#000000″ styling_border_size=”1″ styling_border_radius=”6″ styling_border_opacity=”100″ styling_shine=”Y” styling_gradient_start_color=”#ffff00″ styling_gradient_end_color=”#ffa035″ drop_shadow_panel=”N” inset_shadow_panel=”N” align=”center” href=”https://hitandruncandlesticks.com/contact/” new_window=”Y”/]
Email us back and let us know why your not a member and you could win a $20.00 gift card to Amazon. Will will be giving 5 Amazon gift cards away.
200 shares of OMER was worth $744.00 Yesterday –
Hit and Run Candlesticks Movers Yesterday
- OMER 15.5%
- HDP 10.76%
- SGMS 8.35%
What is a Trade Idea Watchlist?
A trade idea watchlist is a list of stocks that we feel will move in our desired direction over a swing trader’s time frame. That time could be one to 15 days for example. From that watchlist, we wait until price action meets our conditions for a trade.
MEMBERS ONLY
Investing and Trading involve significant financial risk and are not suitable for everyone. No communication from Hit and Run Candlesticks Inc. is financial or trading advice. All information is intended for Educational Purposes Only. Terms of Service.
Rick Saddler is not a licensed financial adviser nor does he offer trade recommendations or advice to anyone except for the trading desk of Hit and Run Candlesticks Inc.
Morning Futures Are Trying To Bounce the Market
(SPY) The morning futures are trying to bounce the market with help from our 4-hour chart $242.90 support line. Yesterday I was asked how we came up with $242.90? I used the 4-hour chart, and the Volatility stops. When I was looking at charts, I noticed the 4-hour chart had a string of Volatility Stop dots, and I laid a line just below. If you have the Volatility Stops on your chart, you can see how price slipped below, but the closing price stayed above. We remain very cautious.
Free Trade Idea – PLUG
 PLUG (Plug Power Inc) Started it’s pattern back on May 18, followed by a lot of indecision then the Bullish Morning Star appeared followed by a PBO.
With on-demand recorded webinars, eBooks, and videos, member and non-member eLearning, plus the Live Trading Rooms, there is no end your trading education here at the Hit and Run Candlestick, Right Way Option, Strategic Swing Trade Service and Trader Vision.
Conditions For The PLUG Trade
- Bullish Engulf
- 12 days being inside
- Bullish Morning Star
- 3 bar PBO
- Bullish Harami
- Rising
- Swing or swings: 20% Plus
Why Trade With Hit and Run Candlesticks
HMHC is up 29.86% from our members only post on April 10, 2017; Education builds confidence.
300 shares of NVCR was worth $945.00 Yesterday –
Hit and Run Candlesticks movers Yesterday
- OMER 11.84%
- DVAX 9.72%
- IPI 5.48%
What is a Trade Idea Watchlist?
A trade idea watchlist is a list of stocks that we feel will move in our desired direction over a swing trader’s time frame. That time could be one to 15 days for example. From that watchlist, we wait until price action meets our conditions for a trade.
Investing and Trading involve significant financial risk and are not suitable for everyone. No communication from Hit and Run Candlesticks Inc. is financial or trading advice. All information is intended for Educational Purposes Only. Terms of Service.
Rick Saddler is not a licensed financial adviser nor does he offer trade recommendations or advice to anyone except for the trading desk of Hit and Run Candlesticks Inc.
Will We See Another Test Of Support?
(SPY) Will we see another test of support? Friday the SPY tested the T-Line and May 25,26, 31 – June 2 support line ($241.75) but the buyers closed us above the T-Line. The QQQ’s took a huge hit Friday well below the T-Line and below the lower T-Line Band. The QQQ’s did find support near the 34-EMA and the Mat 14 support line. I suspect we see a bit more weakness, there for the $241.75 support line will be key to bullishness or more correction.
Free Trade Idea – ACOR
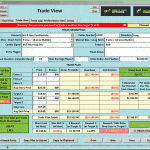 ACOR (Acorda Therapeutics Inc) as found a bottom at $13.80, Bulls have stepped in pushing the Bears out. Price has risen know to a tradable bottom. To learn more about the ACOR chart login to the trading room or what for a trade of the week video.
With on-demand recorded webinars, eBooks, and videos, member and non-member eLearning, plus the Live Trading Rooms, there is no end your education. Start small and learn
Conditions For The ACOR Trade
- RBB Pattern
- Tweezer Bottom
- Near Bullish Engulf
- Bullish Morning Star
- Bullish J-Hook
- Rising
- Over 25% Swing (s) possible
Why Trade With Hit and Run Candlesticks
NVCR is up 21.91% from our members only post on June 1, 2017; Education builds confidence.
300 shares of NVCR was worth $825.00 Friday –
What is a Trade Idea Watchlist?
A trade idea watchlist is a list of stocks that we feel will move in our desired direction over a swing trader’s time frame. That time could be one to 15 days for example. From that watchlist, we wait until price action meets our conditions for a trade.
MEMBERS ONLY
Investing and Trading involve significant financial risk and are not suitable for everyone. No communication from Hit and Run Candlesticks Inc. is financial or trading advice. All information is intended for Educational Purposes Only. Terms of Service.
Rick Saddler is not a licensed financial adviser nor does he offer trade recommendations or advice to anyone except for the trading desk of Hit and Run Candlesticks Inc.
3-Day Chart – Bullish Doji Continuation Pattern
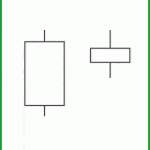 (SPY) Another indecision Doji was formed on the SPY pulling together a Bullish Doji continuation pattern on the 3-day chart. The daily and the 2-day chart are working on a Pop Out of The Box Pattern. Bottom line at yesterday’s close and the past week the SPY has more buyers than sellers. It is important we see proper chart pattern follow through.
It’s Friday – No Trade Idea
Take time today to reflect on your trades the past couple weeks. Did you make a plan for each trade? Do you feel more comfortable with trades that have a plan or without a plan?
With on-demand recorded webinars, eBooks, and videos, member and non-member eLearning, plus the Live Trading Rooms, there is no end your education.
Why Trade With Hit and Run Candlesticks
DVAX is up 57% from our members only post on March 1, 2017; Education builds confidence.
800 shares of IRBT was worth $2080.00 Yesterday – A Coach can help with clearing the path to success.
[button_2 color=”light-green” align=”center” href=”https://hitandruncandlesticks.com/private-personal-coaching-right-from-the-pros/” new_window=”Y”]See Our Trading Coaches[/button_2]
What is a Trade Idea Watchlist?
A trade idea watchlist is a list of stocks that we feel will move in our desired direction over a swing trader’s time frame. That time could be one to 15 days for example. From that watchlist, we wait until price action meets our conditions for a trade.
Investing and Trading involve significant financial risk and are not suitable for everyone. No communication from Hit and Run Candlesticks Inc. is financial or trading advice. All information is intended for Educational Purposes Only. Terms of Service.
Rick Saddler is not a licensed financial adviser nor does he offer trade recommendations or advice to anyone except for the trading desk of Hit and Run Candlesticks Inc.
Price Above T-Line For The Twelfth Day
(SPY) Yesterday the SPY closed plus .19% with a Doji. And the Bulls have kept the price above the T-Line for the twelveth day. We currently have a 3 bar pullback; this could be a setup for a J-Hook continuation pattern. Two of the four pieces are in place. Hit and Run Candlesticks will stay on top of the market pattern.
Free Trade Idea – KEM
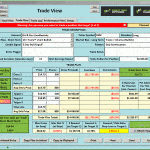 KEM (Kemet Corp) Continues to trend with several bullish chart patterns working. With Bullish follow through we will be looking for a couple of swings from 10% to 30%. We will share more about the KEM chart pattern in Trading Room #2 today.
With on-demand recorded webinars, eBooks, and videos, member and non-member eLearning, plus the Live Trading Rooms, there is no end your education. Start small and learn
Conditions For The KEM Trade
- Doji Continuation pattern
- Cup & Handle
- Bullish J-Hook
- Rising
- Bullish Engulf (3-day chart)
- Doji Continuation
- Over 30% possible
Why Trade With Hit and Run Candlesticks
IRBT is up 19.18% from our members only post on May 2, 2017; Education builds confidence.
100 shares of IRBT was worth $1597.00 Yesterday – Subscribe Now
What is a Trade Idea Watchlist?
A trade idea watchlist is a list of stocks that we feel will move in our desired direction over a swing trader’s time frame. That time could be one to 15 days for example. From that watchlist, we wait until price action meets our conditions for a trade.
MEMBERS ONLY
Investing and Trading involve significant financial risk and are not suitable for everyone. No communication from Hit and Run Candlesticks Inc. is financial or trading advice. All information is intended for Educational Purposes Only. Terms of Service.
Rick Saddler is not a licensed financial adviser nor does he offer trade recommendations or advice to anyone except for the trading desk of Hit and Run Candlesticks Inc.
 IPI (Intrepid Potash Inc.) Was first a members trade idea on May 16, 2017, and as of Friday’s close up 10%. On the monthly chart, I see support above the bottom construction. On a 3-day chart, IPI is An RBB pattern with a Bullish Engulf on the Dotted Deuce.


