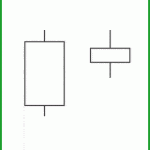
3-Day Chart – Bullish Doji Continuation Pattern
 (SPY) Another indecision Doji was formed on the SPY pulling together a Bullish Doji continuation pattern on the 3-day chart. The daily and the 2-day chart are working on a Pop Out of The Box Pattern. Bottom line at yesterday’s close and the past week the SPY has more buyers than sellers. It is important we see proper chart pattern follow through.
It’s Friday – No Trade Idea
Take time today to reflect on your trades the past couple weeks. Did you make a plan for each trade? Do you feel more comfortable with trades that have a plan or without a plan?
With on-demand recorded webinars, eBooks, and videos, member and non-member eLearning, plus the Live Trading Rooms, there is no end your education.
Why Trade With Hit and Run Candlesticks
DVAX is up 57% from our members only post on March 1, 2017; Education builds confidence.
800 shares of IRBT was worth $2080.00 Yesterday – A Coach can help with clearing the path to success.
What is a Trade Idea Watchlist?
A trade idea watchlist is a list of stocks that we feel will move in our desired direction over a swing trader’s time frame. That time could be one to 15 days for example. From that watchlist, we wait until price action meets our conditions for a trade.
Investing and Trading involve significant financial risk and are not suitable for everyone. No communication from Hit and Run Candlesticks Inc. is financial or trading advice. All information is intended for Educational Purposes Only. Terms of Service.
Rick Saddler is not a licensed financial adviser nor does he offer trade recommendations or advice to anyone except for the trading desk of Hit and Run Candlesticks Inc.


Comments are closed.