TTWO Blue Ice Failure and Bearish “h” Pattern
 TTWO – Because of the Blue Ice Failure and Bearish “h” patterns I have added TTWO to our watchlist for short. Price has been very bullish over the last few months and has now painted a Cradle Top, and now presenting a possible Blue Ice failure with a Bearish “h” Pattern. The full potential of the short can only be reached with bearish follow-through. One plan might be to short below $107.75 with a stop above $113.90
At 9:10 AM ET. We will talk about the technical properties of TTWO with target zones, a couple of logical entries and a protective stop. We will also be showing our trade plan with risk/reward and expected profits.
►Recently Closed Trades
TBT 47%
► Eyes On The Market
Although the SPY is still trending above the T-Line and the T-Line is still rising the recent price action in the Candles are looking a little like a scrooge. In the last 2-weeks, we have seen a few signs that the Bah Hum Bug sellers are hanging around. Yesterday’s Candle and recent candle patterns in the SPY, DIA, QQQ, IWM are taking the cheer out of this week. We have made plenty of money, and there is plenty of money to be made. There are times to sit back and watch, and there are times to trade, what time do you think it is?
►Rick’s Swing Trade ideas – MEMBERS ONLY
30-Day Trial • Monthly • Quarterly • Semi-Annual • Annual
Learn how and what we trade: The T-Line • T-Line Bands • Chart Patterns • Support • Resistance • Patterns • Buy Box • Volatility Stops • Price Action • Candlesticks • Profit Zones • Entry Zones • Protective Stops
Investing and Trading involves significant financial risk and is not suitable for everyone. No communication from Hit and Run Candlesticks Inc. is financial or trading advice. All information is intended for Educational Purposes Only. Terms of Service.
Rick Saddler is not a licensed financial adviser nor does he offer trade recommendations or advice to anyone except for the trading desk of Hit and Run Candlesticks Inc.
*************************************************************************************
SYNT Produced a Bullish Belt Hold
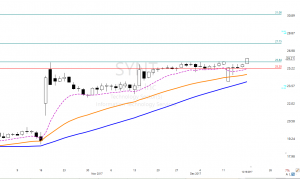 SYNT – Last week SYNT produced a Bullish Belt Hold, and the sellers have stepped away. The bulls close SYNT yesterday above the November high, and the chart looks ready to take on the next resistant levels and target zones.
At 9:10 AM ET. We will talk about the technical properties of SYNT with target zones, a couple of logical entries and a protective stop. We will also be showing our trade plan with risk/reward and expected profits.
►Subscribing Members login: for the Trader Vision Trade Plan
► Eyes On The Market
The SPY closed above its morning gap with a wick longer than it’s body, this indicates the buyers and seller are in a battle, and the seller was able to push price down from it’s high. If the buyers give up the sellers will create a low below $267.98. Overall the buyers are leading the trend.
Rick’s Swing Trade ideas – MEMBERS ONLY
30-Day Trial • Monthly • Quarterly • Semi-Annual • Annual
Learn how and what we trade: The T-Line • T-Line Bands • Chart Patterns • Support • Resistance • Patterns • Buy Box • Volatility Stops • Price Action • Candlesticks • Profit Zones • Entry Zones • Protective Stops
Investing and Trading involves significant financial risk and is not suitable for everyone. No communication from Hit and Run Candlesticks Inc. is financial or trading advice. All information is intended for Educational Purposes Only. Terms of Service.
Rick Saddler is not a licensed financial adviser nor does he offer trade recommendations or advice to anyone except for the trading desk of Hit and Run Candlesticks Inc.
*************************************************************************************
Take Profits and Count Your Money

TGIF, Take a few profits and count your money. I love Fridays, Fridays are a day to wind down the week, and plan for next week. Today I think we might start to create a short watch list in the trading room for all HRC Members.
At 9:10 AM ET. Today we will be looking at your trade ideas, technical properties and target zones, a couple of logical entries and a protective stop.
► Must Read Trade Update (AMPE)
On November 30, we shared and in detail the technical properties of AMPE in the Trading Room, Yesterday the profits were about 40% or $700.00, with 1000 shares. November 30 price found support and then consolidated until it found an open door.
► Eyes On The Market
It looks like the SPY is feeling a little pressure and needs to cool its heel. Yesterday’s price action was follow through to Wednesdays little shooting star. (You can see it better in the 2-day chart) Today we are likely to breach the T-Line and possibly test the Lower T-Line. Below $264.00 the recent low $262.71 may get tested.
CBOE Market Volatility Index has presented us with 3 White Soldiers in the daily chart; the three-day chart is catching my eye, I will explain more in the members Trading Room today
Rick’s Swing Trade ideas – MEMBERS ONLY
30-Day Trial • Monthly • Quarterly • Semi-Annual • Annual
Learn how and what we trade: The T-Line • T-Line Bands • Chart Patterns • Support • Resistance • Patterns • Buy Box • Volatility Stops • Price Action • Candlesticks • Profit Zones • Entry Zones • Protective Stops
Investing and Trading involves significant financial risk and is not suitable for everyone. No communication from Hit and Run Candlesticks Inc. is financial or trading advice. All information is intended for Educational Purposes Only. Terms of Service.
Rick Saddler is not a licensed financial adviser nor does he offer trade recommendations or advice to anyone except for the trading desk of Hit and Run Candlesticks Inc.
*************************************************************************************
STRL Gapped And Strolled Sideways
 STRL – Gapped and strolled sideways for about a month now in a tight trading range. Price action seems to be playing well with support, the lower T-Line band, and the V-Stop. I am bullish above $17.20 with a buy zone between $17.20 and $18.40.
At 9:10 AM ET. We will talk about the technical properties of STRL with target zones, a couple of logical entries and a protective stop. We will also be showing our trade plan with risk/reward and expected profits.
►Subscribing Members login: for the Trader Vision Trade Plan
► Must Read Trade Update (LB)
On October 9, we shared and in detail the technical properties of LB in the Trading Room, Yesterday the profits were about 37% or $1590.00, with 100 shares. After the October 5th candle LB followed The Lower T-Line Band and the V-Stops perfectly.
[button_2 color=”orange” align=”center” href=”https://ob124.infusionsoft.com/app/orderForms/Gold-Monthly-Membership-85″ new_window=”Y”]Learn how to use the T-Line Bands and The V-Stop • Cancel Anytime[/button_2]
► Eyes On The Market
The market survived the FOMC! However, you see the intraday price action or even the daily for that matter the trend is still bullish. The SPY has put together six higher lows and highs working to beat the December 4 high. The $25000 magnet in the DOW may be stronger than the bears can handle, just something to think to ponder.
The VXX short-term futures are trending down below the V-Stop and the Lower T-Line Band, (No change from yesterday)
Rick’s Swing Trade ideas – MEMBERS ONLY
30-Day Trial • Monthly • Quarterly • Semi-Annual • Annual
Learn how and what we trade: The T-Line • T-Line Bands • Chart Patterns • Support • Resistance • Patterns • Buy Box • Volatility Stops • Price Action • Candlesticks • Profit Zones • Entry Zones • Protective Stops
Investing and Trading involves significant financial risk and is not suitable for everyone. No communication from Hit and Run Candlesticks Inc. is financial or trading advice. All information is intended for Educational Purposes Only. Terms of Service.
Rick Saddler is not a licensed financial adviser nor does he offer trade recommendations or advice to anyone except for the trading desk of Hit and Run Candlesticks Inc.
*************************************************************************************
GLUU Bullish W Pattern
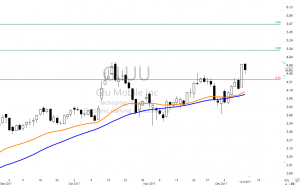 GLUU – Is testing the October highs with a little pullback yesterday. GLUU also has broken out of a Bullish “W” pattern while following the 34-EMA bullish trend. With a price above the weekly 200 period moving average GLUU could be headed to challenge the $7.00 area. Take a look at the weekly chart and notice the Cup being formed.
At 9:10 AM ET. We will talk about the technical properties of GLUU with target zones, a couple of logical entries and a protective stop. We will also be showing our trade plan with risk/reward and expected profits.
►Subscribing Members login: for the Trader Vision Trade Plan
[arrows style=”arrow-red-9.png” align=”left”]
► Must Read Trade Update (BNED)
On November 30, we shared and in detail the technical properties of BNED in the Trading Room, Yesterday the profits were about 33% or $400.00, with 200 shares. BNED has followed the T-Lines up and is now creating a bullish J-Hook continuation pattern; this could be a clue that aside from normal profit-taking pullbacks the trend is still bullish.
[button_2 color=”green” align=”center” href=”https://hitandruncandlesticks.com/hrc-rwo-30-day-offer/” new_window=”Y”]Trial ? Hit and Run or Right Way • No Auto Billing[/button_2]
► Eyes On The Market
Yesterday the market was mostly mixed, likely waiting to hear about the FOMC minutes and what Jannet Yelling has to say today. The SPY broke out and closed above the December 4 candle, if you look at you 4-day chart you can see a Bullish Doji continuation pattern. I am hearing from so many traders that feel this market is so overbought; I agree to remember price action and the trend is what to watch. As of yesterday, December 12-13-17 does the chart look bullish or bearish? Depending on the FOMC minutes price could accelerate higher or drop like a rock, we simply can not predict that.
The VXX short-term futures are trending down below the V-Stop and the Lower T-Line Band.
Rick’s trade ideas for the day – MEMBERS ONLY
30-Day Trial • Monthly • Quarterly • Semi-Annual • Annual
Learn how and what we trade: The T-Line • T-Line Bands • Chart Patterns • Support • Resistance • Patterns • Buy Box • Volatility Stops • Price Action • Candlesticks • Profit Zones • Entry Zones • Protective Stops
Investing and Trading involves significant financial risk and is not suitable for everyone. No communication from Hit and Run Candlesticks Inc. is financial or trading advice. All information is intended for Educational Purposes Only. Terms of Service.
Rick Saddler is not a licensed financial adviser nor does he offer trade recommendations or advice to anyone except for the trading desk of Hit and Run Candlesticks Inc.
*************************************************************************************
Looking At The 3-Day Chart
 SND – The Bullish trend started in mid-August3. Looking at the 3-day chart price action is being supported by the September highs, the last 7 bars (3-day chart) has painted a Pop Out of The Box pattern. Bullish over $8.60 with profit target zones above.
At 9:10 AM ET. We will talk about the technical properties of SND with target zones, a couple of logical entries and a protective stop. We will also be showing our trade plan with risk/reward and expected profits.
To the member’s area for the Trader Vision Trade Plan
► Must Read Trade Update (EYES)
On December 4, we shared and covered in detail the technical properties of EYES in the Trading Room, Yesterday the profits were about 47% or $500.00, with 800 shares. EYES has been creating a bottom, after breaking out ran to the next profit zone. The PBO Bullish Engulf on December 1 kicked off the run.
[button_1 text=”Monthly%20Membership%20Only%2085.00″ text_size=”32″ text_color=”#000000″ text_bold=”Y” text_letter_spacing=”0″ subtext_panel=”Y” subtext=”Start%20Now%20%E2%80%A2%20Cancel%20Anytime” subtext_size=”18″ subtext_color=”#0c23e4″ subtext_bold=”Y” subtext_letter_spacing=”0″ text_shadow_panel=”N” styling_width=”40″ styling_height=”30″ styling_border_color=”#000000″ styling_border_size=”1″ styling_border_radius=”6″ styling_border_opacity=”100″ styling_shine=”Y” styling_gradient_start_color=”#ffff00″ styling_gradient_end_color=”#ffa035″ drop_shadow_panel=”N” inset_shadow_panel=”N” align=”center” href=”https://hitandruncandlesticks.com/hit-and-run-candlesticks/” new_window=”Y”/]
► Eyes On The Market
The SPY has worked hard to overcome the Bearish Engulf on December 4 and has done a great job. The recent pullback used the V-Stop, and the T-Lines have continued to trend. The 4-day chart has painted a Bullish Doji continuation pattern. As of the close, yesterday price action still suggests bullishness. The VXX short-term futures are trending down below the V-Stop and the Lower T-Line Band.
Rick’s trade ideas for the day – MEMBERS ONLY
30-Day Trial • Monthly • Quarterly • Semi-Annual • Annual
Learn how and what we trade: The T-Line • T-Line Bands • Chart Patterns • Support • Resistance • Patterns • Buy Box • Volatility Stops • Price Action • Candlesticks • Profit Zones • Entry Zones • Protective Stops
Investing and Trading involves significant financial risk and is not suitable for everyone. No communication from Hit and Run Candlesticks Inc. is financial or trading advice. All information is intended for Educational Purposes Only. Terms of Service.
Rick Saddler is not a licensed financial adviser nor does he offer trade recommendations or advice to anyone except for the trading desk of Hit and Run Candlesticks Inc.
*************************************************************************************
Watching The 3-Day Chart
 HK – I am watching the 3-day chart starting with the candle on July 12. The chart pattern from July 12 has floated sideways with support around $5.80. Then on November 2, a little upward trend started. Now support has kicked up a little to about $5.60. Notice how the 34-EMA has risen above the 200-SMA
At 9:10 AM ET. We will talk about the technical properties of HK with target zones, a couple of logical entries and a protective stop. We will also be showing our trade plan with risk/reward and expected profits.
To the member’s area for the Trader Vision Trade Plan that we have created for ourselves.
► Must Read Trade Update (TRLD)
On August 31, we shared and covered in detail the technical properties of TLRD in the Trading Room, Friday the profits were about 64.20% or $764.00, with 100 shares. TLRD broke out of out (RBB Pattern) and continued the trend with minor pullback opportunities (PBO). Moving the stop up to about $18.85 would make sense.
[button_2 color=”orange” align=”center” href=”https://ob124.infusionsoft.com/app/orderForms/HRC-Hit–Run-Candlesticks-30-day-Trial-1497″ new_window=”Y”]30-Day Trial Hit and Run Candlesticks • Earn While You Learn[/button_2]
► Eyes On The Market
The SPY was able to rise off the T-Line last week and close Bullish. On the daily chart, a Bullish J-Hook Continuation pattern is forming, A close above $266.38 would confirm the Bullish J-Hook Pattern. Sometimes it’s hard to make sense of a grouping of candles on a daily chart, so you might want to look at a higher time frame. Take a look at the 4-day chart; you can see a bullish Doji Continuation Patter formed. The bulls simply need to follow through and stacking.
Rick’s trade ideas for the day – MEMBERS ONLY
30-Day Trial • Monthly • Quarterly • Semi-Annual • Annual
Learn how and what we trade: The T-Line • T-Line Bands • Chart Patterns • Support • Resistance • Patterns • Buy Box • Volatility Stops • Price Action • Candlesticks • Profit Zones • Entry Zones • Protective Stops
Investing and Trading involves significant financial risk and is not suitable for everyone. No communication from Hit and Run Candlesticks Inc. is financial or trading advice. All information is intended for Educational Purposes Only. Terms of Service.
Rick Saddler is not a licensed financial adviser nor does he offer trade recommendations or advice to anyone except for the trading desk of Hit and Run Candlesticks Inc.
*************************************************************************************
Mostly Winning Trades
This past week I have seen mostly winning trades come out of the trading room with only a few losses, but one thing is for sure the trading has slowed because of the market. For the most part, the SPY has been unsure of its self but held the -Line, the QQQ’s didn’t like being above the T-Line so had to test what it was like below (now back above), IWM and the DIA’s liked being above the T-Line and stayed. IYT felt like the king of the hill held proud above the T-Line the entire week and last week too. Leading sectors above the T-Line this week has been, (SX100 Industrials) (SX60 Healthcare) (SX20 Consumer Cyclical) (SX50 Consumer Defensive)Tax bill, Employment numbers, Fed Rate Increase are just to name a few issues that could change the course of the charts.
►Sample • Members Recent Big Winners
BEND 25.55% • DEPO 46.14% • EYES 19.12% • TLRD 63.96% • X 27.96% • 21.5 • VIAB 13.35%
►News From Our Team
Trader Vision 20/20 – I have downloaded the newest version this morning, and the word is to give it a spin. We are very excited that Trader Vision 20/20 is just days from being launched. What is one thing the top traders do? They plan their trades and trade their plan. Trader Vision 20/20 is perfect for planning your trade.
Before Christmas is announcing a way that most (not all) will be able to cut their membership cost by 50-100% – I am currently using this product and love it. By the way, there is NO COST TO YOU
► Eyes On The Market
On the daily chart, the buyers have kept the closing price above the T-Line, this suggests the bulls still control the trend, and the bears are just grazing a little. After all, the bear needs to eat too. A close below $262.15 will put a strain on the trend that the buyer may not like. The VIX settled down a bit yesterday closing back below the Lower T-Line Band; this is good for the bulls.
Rick’s trade ideas for the day – MEMBERS ONLY
30-Day Trial • Monthly • Quarterly • Semi-Annual • Annual
Investing and Trading involves significant financial risk and is not suitable for everyone. No communication from Hit and Run Candlesticks Inc. is financial or trading advice. All information is intended for Educational Purposes Only. Terms of Service.
Rick Saddler is not a licensed financial adviser nor does he offer trade recommendations or advice to anyone except for the trading desk of Hit and Run Candlesticks Inc.
Bullish Morning Star Close Yesterday
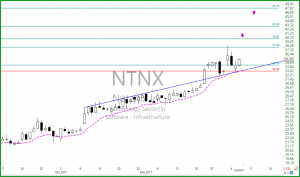 NTNX – Presented us with a Bullish Morning Star at the close yesterday and a Bullish T-Line Run. NTNX has broken out of resistance and has tested support. The 34-EMA is trending higher and is close to making an all-time new high; the T-Line has already made an all-time new high.
At 9:10 AM ET. We will talk about the technical properties of NTNX with target zones, a couple of logical entries and a protective stop. We will also be showing our trade plan with risk/reward and expected profits.
►Subscribing Members log in to the member’s area for theTrader Vision Trade Plan
► Must Read Trade Update (TWNK)
On November 27, we shared and covered in detail the technical properties of TWNK in the Trading Room, Yesterday the profits were about 11.75% or $151.00, with 100 shares. TWNK has been in a Rounded Bottom Breakout pattern, with the Bullish Engulf close yesterday TWNK may be ready to challenge the 200-SMA
[button_2 color=”green” align=”center” href=”https://hitandruncandlesticks.com/hrc-rwo-30-day-offer/” new_window=”Y”]Master The Pullback Opportunities (PBO) With Hit and Run Candlesticks[/button_2]
► Eyes On The Market
The pullback in the SPY has reached the T-Line as expected. Now, what will the BULLS do with it? Yesterday made a new low to the T-Line then closed above the T-Line with a little Doji/Spinning To candle. The Volatility Stops helped price with support along with declining volume. With positive price action and a little candle stacking the Bulls can continue the bullish course. Selling below the T-Line would suggest a test of the December low $260.76.
Rick’s trade ideas for the day – MEMBERS ONLY
30-Day Trial • Monthly • Quarterly • Semi-Annual • Annual
Learn how and what we trade: The T-Line • T-Line Bands • Chart Patterns • Support • Resistance • Patterns • Buy Box • Volatility Stops • Price Action • Candlesticks • Profit Zones • Entry Zones • Protective Stops
Investing and Trading involves significant financial risk and is not suitable for everyone. No communication from Hit and Run Candlesticks Inc. is financial or trading advice. All information is intended for Educational Purposes Only. Terms of Service.
Rick Saddler is not a licensed financial adviser nor does he offer trade recommendations or advice to anyone except for the trading desk of Hit and Run Candlesticks Inc.
*************************************************************************************
Technical Problems Today
Technical Difficulties– Due to technical problems today we will not have any trade ideas posted today.
At 9:10 AM ET. We will talk about the technical properties of a few charts with target zones, a couple of logical entries and a protective stop. We will also be showing our trade plan with risk/reward and money expected.
►Website Orientation
On December 5, Right Way Options (Doug Campbell) created a Website Orientation video – Video Replay
► Must Read Trade Update (DEPO)
On November 9, we shared and covered in detail the technical properties of DEPO in the Trading Room, Yesterday the profits were about 38% or $216.00, with 100 shares. DEPO broke into a Rounded Bottom Breakout pattern and has been a Bullish T-Line Run ever since.
► Eyes On The Market
Even with a couple of candles that belong to the sellers, the SPY has not given up the bullish trend, below $260.70 would be a different story. The jobs report, and the outcome of the tax bill could have an impact on the market.
Rick’s trade ideas for the day – MEMBERS ONLY
30-Day Trial • Monthly • Quarterly • Semi-Annual • Annual
Learn how and what we trade: The T-Line • T-Line Bands • Chart Patterns • Support • Resistance • Patterns • Buy Box • Volatility Stops • Price Action • Candlesticks • Profit Zones • Entry Zones • Protective Stops
Investing and Trading involves significant financial risk and is not suitable for everyone. No communication from Hit and Run Candlesticks Inc. is financial or trading advice. All information is intended for Educational Purposes Only. Terms of Service.
Rick Saddler is not a licensed financial adviser nor does he offer trade recommendations or advice to anyone except for the trading desk of Hit and Run Candlesticks Inc.
********************************************************************************************************************************


