
GLUU Bullish W Pattern
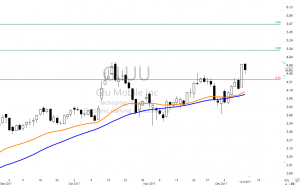 GLUU – Is testing the October highs with a little pullback yesterday. GLUU also has broken out of a Bullish “W” pattern while following the 34-EMA bullish trend. With a price above the weekly 200 period moving average GLUU could be headed to challenge the $7.00 area. Take a look at the weekly chart and notice the Cup being formed.
At 9:10 AM ET. We will talk about the technical properties of GLUU with target zones, a couple of logical entries and a protective stop. We will also be showing our trade plan with risk/reward and expected profits.
►Subscribing Members login: for the Trader Vision Trade Plan
[arrows style=”arrow-red-9.png” align=”left”]► Must Read Trade Update (BNED)
On November 30, we shared and in detail the technical properties of BNED in the Trading Room, Yesterday the profits were about 33% or $400.00, with 200 shares. BNED has followed the T-Lines up and is now creating a bullish J-Hook continuation pattern; this could be a clue that aside from normal profit-taking pullbacks the trend is still bullish.
[button_2 color=”green” align=”center” href=”https://hitandruncandlesticks.com/hrc-rwo-30-day-offer/” new_window=”Y”]Trial ? Hit and Run or Right Way • No Auto Billing[/button_2]
► Eyes On The Market
Yesterday the market was mostly mixed, likely waiting to hear about the FOMC minutes and what Jannet Yelling has to say today. The SPY broke out and closed above the December 4 candle, if you look at you 4-day chart you can see a Bullish Doji continuation pattern. I am hearing from so many traders that feel this market is so overbought; I agree to remember price action and the trend is what to watch. As of yesterday, December 12-13-17 does the chart look bullish or bearish? Depending on the FOMC minutes price could accelerate higher or drop like a rock, we simply can not predict that.
The VXX short-term futures are trending down below the V-Stop and the Lower T-Line Band.
Rick’s trade ideas for the day – MEMBERS ONLY
30-Day Trial • Monthly • Quarterly • Semi-Annual • Annual
Learn how and what we trade: The T-Line • T-Line Bands • Chart Patterns • Support • Resistance • Patterns • Buy Box • Volatility Stops • Price Action • Candlesticks • Profit Zones • Entry Zones • Protective Stops
Investing and Trading involves significant financial risk and is not suitable for everyone. No communication from Hit and Run Candlesticks Inc. is financial or trading advice. All information is intended for Educational Purposes Only. Terms of Service.
Rick Saddler is not a licensed financial adviser nor does he offer trade recommendations or advice to anyone except for the trading desk of Hit and Run Candlesticks Inc.
*************************************************************************************


Comments are closed.