
QURE Testing Support & Resistance
QURE Testing Support & Resistance
 On a weekly chart, QURE has been testing support and resistance for about 11 bars. Then POW – buyers finally found a way out and finally broke out. The Ascending Triangle breakout could push QURE to it’s 2015 high and produce a few good swings for the swing trader. Remember to check out the Event Calendar located at the top left of any webpage.
►Listen to your Rules
The Market or any chart, do you feel comfortable buying a stock long if the price is not trending in your favor? If you do, you may be a predictor. Some predictors make money; most do not. As yourself a few questions.
- What is the 34-EMA doing in relationship to itself 20 -30 – days ago?
- What is the T-Line doing in relationship to itself 20 -30 – days ago?
- What is the T-Line doing in relationship to the 34-EMA?
- What is Price doing in relation to both the T-Line and the 34-EMA?
►Learn the Power Of Simple Trading Techniques
On January 31, Rick shared SFLY as a trade for members to consider and how to use the trading tools listed below. Currently, the profits could have been about 33% or $1770.00 with 100 shares. Using our Simple, Proven Swing Trade Tools and techniques to achieve swing trade profits.
Candlesticks • Price Action • T-Line • T-Line Bands • Support • Resistance • Trend • Trendlines • Chart Patterns • Buy Box • Volatility Stops • Profit Zones • Entry Zones • Protective Stops • RBB Rounded Bottom Breakout Strategy • Pop Out of The Box Strategy • Pinball Strategy • Trade Planning… Learn More
►The VXX short-term futures
The VXX is built on fear, and it’s carrying a great deal of fear. VXX holding over the 200-SMA on the daily is something to take note.
►Rick’s Swing Trade ideas
Member Login – Full Trade List
30-Day Trial • Monthly • Quarterly • Semi-Annual • Annual
To learn more about our trading tools join us in the trading room or consider Private Coaching. Rick will help coach you to trading success.
Investing and Trading involve significant financial risk and is not suitable for everyone. No communication from Hit and Run Candlesticks Inc. is financial or trading advice. All information is intended for Educational Purposes Only. Terms of Service.
Rick Saddler is not a licensed financial adviser nor does he offer trade recommendations or advice to anyone except for the trading desk of Hit and Run Candlesticks Inc.
*************************************************************************************
Friday We Posted SKX SKX bullish over $41.35 $40.30 Stop
Friday We Posted SKX
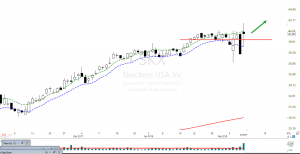 Friday we posted SKX in our blog (trade alert). SKX closed with a Doji Friday with the 4-day chart presenting up with a Pullback Opportunity Bullish Engulf find support on the Lower T-Line and the V-Stops. Hit and Run Candlesticks bought long SKX Friday. SKX looks as if it may challenge the $51-$52 area after a successful breakout of the current resistance.
►Listen to your Rules
Be wise, don’t rush in and listen to your trading rules. This what I will tell myself today over and over. In the SPY price is still trending down below the T-Line and the T-Line Bands (both upper and lower). On the daily chart, Lower highs and lower lows are present when this chart pattern reverses then and only then will the market be in a good position to attack. Just my plan, what’s yours?
[button_1 text=”15%25%20Members%20and%20Early%20Registration%20Ends%20Tonight%202-12-2018″ text_size=”32″ text_color=”#000000″ text_bold=”Y” text_letter_spacing=”0″ subtext_panel=”Y” subtext=”Click%20Here%20To%20Learn%20More” subtext_size=”18″ subtext_color=”#f70808″ subtext_bold=”Y” subtext_underline=”Y” subtext_letter_spacing=”0″ text_shadow_panel=”N” styling_width=”40″ styling_height=”30″ styling_border_color=”#000000″ styling_border_size=”1″ styling_border_radius=”6″ styling_border_opacity=”100″ styling_shine=”Y” styling_gradient_start_color=”#ffff00″ styling_gradient_end_color=”#ffff00″ drop_shadow_panel=”N” inset_shadow_panel=”N” align=”center” href=”https://ob124-b30d0c.pages.infusionsoft.net” new_window=”Y”/]►Learn the Power Of Simple Trading Techniques
On January 8, Rick shared VSTO as a trade for members to consider and how to use the trading tools listed below. Currently, the profits could have been about 16% or $250.00 with 100 shares. Using our Simple, Proven Swing Trade Tools and techniques to achieve swing trade profits.
Candlesticks • Price Action • T-Line • T-Line Bands • Support • Resistance • Trend • Trendlines • Chart Patterns • Buy Box • Volatility Stops • Profit Zones • Entry Zones • Protective Stops • RBB Rounded Bottom Breakout Strategy • Pop Out of The Box Strategy • Pinball Strategy • Trade Planning… Learn More
►The VXX short-term futures
The VXX had a big week last week, and many dollars have been made on it bullish move. Now that the VXX is trading over the 200-SMA and has smacked resistance a good little rest is needed.
►Rick’s Swing Trade ideas
Member Login – Full Trade List
30-Day Trial • Monthly • Quarterly • Semi-Annual • Annual
To learn more about our trading tools join us in the trading room or consider Private Coaching. Rick will help coach you to trading success.
Investing and Trading involve significant financial risk and is not suitable for everyone. No communication from Hit and Run Candlesticks Inc. is financial or trading advice. All information is intended for Educational Purposes Only. Terms of Service.
Rick Saddler is not a licensed financial adviser nor does he offer trade recommendations or advice to anyone except for the trading desk of Hit and Run Candlesticks Inc.
*************************************************************************************
Trade Alert Ideas
Trade Alert
SKX has broken out today, if it holds and tests support with a pullback we might consider a trade.
COUP is an another we are considering for a long trade when the time is right
KORS we are waiting for a short set up when the time is right
Tune in thru-out the day we might post on the HRC blog, HRC Smart Phone APP, Twitter, Facebook, StockTwits as trade ideas present themselves.
Recently closed VXX 375% • TWTR 180%
Remember all trade ideas are for your evaluation and consideration
[button_2 color=”blue” align=”center” href=”https://hitandruncandlesticks.com/hrc-rwo-30-day-offer/” new_window=”Y”]30-Day $14.00 Trial • Learn and Earn[/button_2]Hard Week For The Market
Hard Week For The Market
It’s been a hard week for the market (SPY) eight days below the T-Line and in the middle of a Blue Ice Failure Pattern. Yesterday low closed below the previous low and our Dotted Deuce, I can almost hear the 200-SMA calling. Over my past 30-years of trading, I have found it much easier to trade in the direction of the market and ass of the close yesterday our trading trend is still down.
The VIX (CBOE Market Volatility Index) has been on fire and is currently in a bullish stage. A wise trader once told me not to fight the trend.
We feel trading right now will be more risk then the typical trader wants to experience, I am personally in all cash after recently closing my VXX trade for 375% and the TWTR trade for 180%
►Events Calendar
Stay up to date with our events calendar, Webinars/Workshops, and Special Events https://hitandruncandlesticks.com/events/
[button_2 color=”red” align=”center” href=”https://ob124-b30d0c.pages.infusionsoft.net” new_window=”Y”]Professional Traders Summit • Click Here • To Learn More[/button_2]►Everyday At 9:10 AM ET.
Each Morning before the market opens Rick and the HRC members meet up to discuss today’s trade ideas. Rick, we will demonstrate live how each trade could be traded using our Simple Proven Swing Trade Tools
Candlesticks • Price Action • T-Line • T-Line Bands • Support • Resistance • Trends • Trendlines • Chart Patterns • Buy Box • Volatility Stops • Profit Zones • Entry Zones • Protective Stops • RBB Rounded Bottom Breakout Strategy • Pop Out of The Box Strategy • Pinball Strategy • Continuation Patterns • Trade Planning… Learn More
The VXX short-term futures have broken out of the 200-SMA, the VXX needs to pull back a little before they become a long trade. Holding above the 200-SMA in the future should keep the volatility high and the market on its toes.
Rick’s Swing Trade ideas
Member Login – Full Daily List
30-Day Trial • Monthly • Quarterly • Semi-Annual • Annual
Candlesticks • Price Action T-Line • T-Line Bands • Support • Resistance • Trendlines • Chart Patterns • Buy Box • Volatility Stops • Profit Zones • Entry Zones • Protective Stops • RBB Rounded Bottom Breakout Strategy • Pop Out of The Box Strategy • Pinball Strategy • Continuation Patterns
Investing and Trading involve significant financial risk and is not suitable for everyone. No communication from Hit and Run Candlesticks Inc. is financial or trading advice. All information is intended for Educational Purposes Only. Terms of Service.
Rick Saddler is not a licensed financial adviser nor does he offer trade recommendations or advice to anyone except for the trading desk of Hit and Run Candlesticks Inc.
*************************************************************************************
Pesky 50-SMA Featured Trade Idea LULU
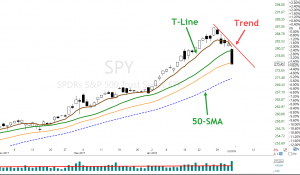
Pesky 50-SMA
The market (SPY) ran into the pesky 50-SMA and was pushed away ending the day with a long wick at the top and a very small body. The candle formation “Inverted Hammer” is a sign the sellers outnumber the buyers unless something changes overnight there is a high probability the next day’s open is lower. The failure at the 50-SMA is a Blue Ice Failure pattern and requires a qualified bullish reversal pattern to challenge and overcome the 50-SMA.
The downtrend is still in play with $259.00 acting as support for now. Price has now drawn a low to a high and today will draw a lower low. Watch the chart for the next clue to a bullish bottom construction or soggy bottom fall out. Looking at the 4-hour chart, we might be drawing a higher low, with follow-through over and a test of the $271.60 area might encourage the buyers to take another run at the pesky 50-Sma
►Featured Trade Ideas
LULU printed a Bullish engulf two days ago and posted follow-through yesterday testing a multi-year high. LULU has the potential of reaching $100.00 or more. LULU has been trending and recently started to consolidate and has met a high number of our conditions for a possible trade. Learn more about how to trade this trade and others with Hit and Run Candlesticks starting at 9:10 ET in the live Trading Room #1
 [button_2 color=”blue” align=”center” href=”https://hitandruncandlesticks.com/hrc-rwo-30-day-offer/” new_window=”Y”]What would you spend to change your life?[/button_2]
►Learn the Power Of Simple Trading Techniques
On December 26, Rick shared WTW as a trade for members to consider and how to use the trading tools listed below. Currently, the profits could have been about 46% or $2345.00 with 100 shares. Using our Simple, Proven Swing Trade Tools and techniques to achieve swing trade profits.
Candlesticks • Price Action • T-Line • T-Line Bands • Support • Resistance • Trend • Trendlines • Chart Patterns • Buy Box • Volatility Stops • Profit Zones • Entry Zones • Protective Stops • RBB Rounded Bottom Breakout Strategy • Pop Out of The Box Strategy • Pinball Strategy • Trade Planning… Learn More
►The VXX short-term futures
The VXX is all over the place, the 200-SMA with a doji yesterday well above the downtrend line. While the VXX chart is in a bullish status, I do not believe it is not a buyable chart right now based on our terms.
►Rick’s Swing Trade ideas
Member Login – Full Trade List
30-Day Trial • Monthly • Quarterly • Semi-Annual • Annual
To learn more about our trading tools join us in the trading room or consider Private Coaching. Rick will help coach you to trading success.
Investing and Trading involve significant financial risk and is not suitable for everyone. No communication from Hit and Run Candlesticks Inc. is financial or trading advice. All information is intended for Educational Purposes Only. Terms of Service.
Rick Saddler is not a licensed financial adviser nor does he offer trade recommendations or advice to anyone except for the trading desk of Hit and Run Candlesticks Inc.
*************************************************************************************
Still Closing Below, The T-Line
Still Closing Below, The T-Line
The market (SPY) came back a little yesterday still closing below the T-Line and ALL moving averages that concerning for swing traders. Right now, I do not believe the SPY is showing signs of total collapse, but it has been damaged. The damage requires a constructed bottom that creates support for price action. Yesterdays low may act as support, but we need a few days to prove that. (Proof is better than prediction). A close below yesterdays low or the Dotted Deuce will likely cause a test of the 200-SMA.
►Featured Trade Ideas
ERI is a multi-month trend with the big three moving averages close and tight. Price is showing signs of strength even with the recent sell-off. Learn more about trading this trade and others in the live morning prep 9:10 AM ET, in Room #1

►Learn the Power Of Simple Trading Techniques
On January 9, Rick shared ARRY as a trade for members to consider and how to use the trading tools listed below. Currently, the profits could have been about 29% or $369.00 with 100 shares. Using our Simple, Proven Swing Trade Tools and techniques to achieve swing trade profits.
Candlesticks • Price Action • T-Line • T-Line Bands • Support • Resistance • Trend • Trendlines • Chart Patterns • Buy Box • Volatility Stops • Profit Zones • Entry Zones • Protective Stops • RBB Rounded Bottom Breakout Strategy • Pop Out of The Box Strategy • Pinball Strategy • Trade Planning… Learn More
►The VXX short-term futures
The VXX is all over the place, closed above the 200-SMA and down yesterday. A tradeable chart pattern needs to be formed before we trade it again.
►Rick’s Swing Trade ideas
Member Login – Full Trade List
30-Day Trial • Monthly • Quarterly • Semi-Annual • Annual
Learn more about coaching with Rick Private Coaching.
Investing and Trading involve significant financial risk and is not suitable for everyone. No communication from Hit and Run Candlesticks Inc. is financial or trading advice. All information is intended for Educational Purposes Only. Terms of Service.
Rick Saddler is not a licensed financial adviser nor does he offer trade recommendations or advice to anyone except for the trading desk of Hit and Run Candlesticks Inc.
*************************************************************************************
When Will The Selling Stop
When Will The Selling Stop?
 At 6:30 AM EST this morning the SPY was sitting at $258.79, the big question today will be “When will the selling stop”? The simple answer is when the buyers get in the buying mood. If we open today near the $258.70 area, we will be at or near the. Dotted Deuce. Over my years of trading, I have used the Dotted Deuce and 200-SMA as profit zones, support and resistance. There is a very good chance we will see tradeable action around the Dotted Deuce and the 200-SMA. Remember to be patient and wait for the buy signals and chart setups.
About a week ago in the trading room, we spent some time talking about how the SPY was getting too far from the 50-SMA and that was not normal, something had to give. Now let’s consider the weekly chart and Fib lines. Note that last time the SPY was near the 200-SMA (Mid Feb. 2016). Set a Fib line on the lows and draw to the most recent high. The SPY is currently flirting around the 23.6 retracements. The point I am making is price has pulled much too far away from a major moving average like the 200-SMA for a long-term weekly chart.
►Learn the Power Of Simple Trading Techniques
On November 15, Rick shared ARNA as a trade for members to consider and how to use the trading tools listed below. Currently, the profits could have been about 55% or $1400.00 with 100 shares. Using our Simple, Proven Swing Trade Tools and techniques to achieve swing trade profits.
Candlesticks • Price Action • T-Line • T-Line Bands • Support • Resistance • Trend • Trendlines • Chart Patterns • Buy Box • Volatility Stops • Profit Zones • Entry Zones • Protective Stops • RBB Rounded Bottom Breakout Strategy • Pop Out of The Box Strategy • Pinball Strategy • Trade Planning… Learn More
►The VXX short-term futures
Have exploded hitting $60.00 plus pre-market this morning, note that is over the weekly 50-SMA.
Rick’s Swing Trade ideas
Member Login – Full Trade List
30-Day Trial • Monthly • Quarterly • Semi-Annual • Annual
►To learn more about our trading tools join us in the trading room or consider Private Coaching.
Investing and Trading involve significant financial risk and is not suitable for everyone. No communication from Hit and Run Candlesticks Inc. is financial or trading advice. All information is intended for Educational Purposes Only. Terms of Service.
Rick Saddler is not a licensed financial adviser nor does he offer trade recommendations or advice to anyone except for the trading desk of Hit and Run Candlesticks Inc.
*************************************************************************************
Clearly Below the T-Line Caution!
Clearly Below the T-Line
 The SPY is clearly below the T-Line. Friday the SPY ran through the 20-SMA then landed on the 34-EMA Friday with a gap down on monster volume. This combination can only spell trouble! We always talk about Fridays should be a day to take profits and count your money. With the Bears still grazing this morning, The challenge of the 50-SMA seems likely this week. Because of the speed of the decline from Friday to this morning, I do not believe chasing is a wise idea. We will commonly look for trades after the market opens today and when the panic has calmed down. Throughout the day we will point out shorts and longs in our member’s blog area.
►Recent Trades VXX 375%
►Learn the Power Of Simple Trading Techniques
On December 13, Rick shared BOOT as a trade for members to consider and how to use the trading tools listed below. Currently, the profits could have been about 24.7% or $380.00 with 100 shares. Using our Simple, Proven Swing Trade Tools and techniques to achieve swing trade profits.
Candlesticks • Price Action • T-Line • T-Line Bands • Support • Resistance • Trend • Trendlines • Chart Patterns • Buy Box • Volatility Stops • Profit Zones • Entry Zones • Protective Stops • RBB Rounded Bottom Breakout Strategy • Pop Out of The Box Strategy • Pinball Strategy • Trade Planning… Learn More To learn more about our trading tools join us in the trading room or consider Private Coaching.
The VXX short-term futures –
I closed my VXX trade for 375% Friday, a good day to take profits, the VXX is on its way to tag our $36.75 line.
Rick’s Swing Trade ideas
Members watch for alerts and the MEMBERS BLOG – Login required
30-Day Trial • Monthly • Quarterly • Semi-Annual • Annual
Investing and Trading involve significant financial risk and is not suitable for everyone. No communication from Hit and Run Candlesticks Inc. is financial or trading advice. All information is intended for Educational Purposes Only. Terms of Service.
Rick Saddler is not a licensed financial adviser nor does he offer trade recommendations or advice to anyone except for the trading desk of Hit and Run Candlesticks Inc.
*************************************************************************************
Tools and Rules
Tools and Rules
Don’t chase, don’t predict, don’t use words like “I think” when trying to enter a position. When entering a position, start with common sense and your trading tools and rules. If you don’t have trading tools and rules, ask us.
The market is seeing a little more volatility this past week. Profit trading successfully will need more trading planing. Quality will when out over quantity every time! No two people alike, always follow your rules and only trade charts you understand, always be able to explain your trade to someone.
►Events Calendar
We now have an Events Calendar so you can keep up with webinars and workshops. Below are a few coming up
- Members webinars/workshops
- Public webinars/workshops
- Trader Vision 20/20
- Looking Ahead Sunday Night
- TradeHawk Trading Plat Form
- Special speaker events
- Workshop training events
- Clinics and Workshops
- https://hitandruncandlesticks.com/events/
►A New Training Room
We have created a new Traning room (Room 3) for training, education, coaching and special events. Trading rooms can be found by clicking the big green “Live Trading Room” button at the top of any Hit and Run Candlesticks web page.
►Everyday At 9:10 AM ET.
Each Morning before the market opens Rick and the HRC members meet up to discuss today’s trade ideas. Rick, we will demonstrate live how each trade could be traded using our Simple Proven Swing Trade Tools
Candlesticks • Price Action • T-Line • T-Line Bands • Support • Resistance • Trends • Trendlines • Chart Patterns • Buy Box • Volatility Stops • Profit Zones • Entry Zones • Protective Stops • RBB Rounded Bottom Breakout Strategy • Pop Out of The Box Strategy • Pinball Strategy • Continuation Patterns • Trade Planning… Learn More
► Eyes On The Market
Our closing words yesterday were “Follow the Trend.” What yesterdays close to the SPY was the three close below the T-Line and the futures this morning are suggesting the same today. It looks like the SPY may test the 20-SMA today and even lower, the Vol-Stops has flipped to negative, and continued pressure on the lower T-Line Band is close to the breaking point. Longs are warned when the price action starts to bump its head on the Lower T-Line Band.
The VXX short-term futures pulled back yesterday perfectly to the Lower T-Line Band then closed above the Vol-Stop by the end of the day. The VXX chart is carving out a Bullish (RBB) Rounded Bottom Breakout Pattern.
Rick’s Swing Trade ideas
Member Login – Full Daily List
30-Day Trial • Monthly • Quarterly • Semi-Annual • Annual
Candlesticks • Price Action T-Line • T-Line Bands • Support • Resistance • Trendlines • Chart Patterns • Buy Box • Volatility Stops • Profit Zones • Entry Zones • Protective Stops • RBB Rounded Bottom Breakout Strategy • Pop Out of The Box Strategy • Pinball Strategy • Continuation Patterns
Investing and Trading involve significant financial risk and is not suitable for everyone. No communication from Hit and Run Candlesticks Inc. is financial or trading advice. All information is intended for Educational Purposes Only. Terms of Service.
Rick Saddler is not a licensed financial adviser nor does he offer trade recommendations or advice to anyone except for the trading desk of Hit and Run Candlesticks Inc.
*************************************************************************************


