Uncertainty and Volatility
Uncertainty and Volatility
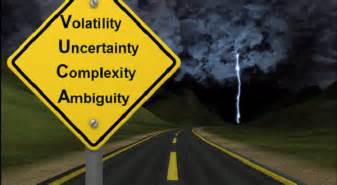 We have an up trending market that displayed a lot of bullish price action last week. On the other hand, we have a North Korean leader playing with nukes and acting like he wants to pick a fight. Mix in a President that has a Twitter account, that he’s not afraid to use and we end up with a lot of uncertainty right at the market highs. Uncertainty and volatility are the likely results. All weekend I have seen people trying to predict what happens next. Some are claiming the market will ignore North Korea and we are going to the up. I saw one ridiculous prediction that the Dow was going to 50,000.
Then there are the Gloom and Doomers predicting that the end is near and the market is destined to collapse. Run for the hills! There are others that suggest the market is setting a trading range that it could be in for years. For what it worth I think predicting is a waste of time. Predicting creates a bias, and bias can blind you to the clues that price is providing. Predicting the market is a lot like trying to rope the wind. It’s a lot of effort for nothing. Focus on price and follow it when it shows a direction.
On the Calendar
This short week Economic Calendar begins and pretty much ends with Factory Orders at 10:00 AM Eastern. Forecasters see a decline in Factory Orders of 3.1% even though most of the underlying data would suggest strength. An interesting discrepancy but the Factory Orders number is normally not expected to move the market substantially. We have three Fed Speakers today and some bond auctions to round out today’s calendar.
There are on quite 30 companies on the Earnings Calendar today. A quick look through them and I don’t see any market moving reports. However, if you happen to hold a company that surprises you with a report because you failed to check it can be very damaging to your account. Make sure always to check and be prepared with a plan around an earnings date.
Action Plan
Friday price left us with a little indecision while it rested ahead of the 3-day weekend. This morning we have a bit of a conundrum. Markets displayed incredible bullishness in the rally off the lows last week. Both the QQQ’s and the SPY managed to break out while the DIA and IWM still have work to do. Toss in the very risky game the North Korean leader is playing, and we end up with with a big pile of uncertainty. I would like to think cooler heads will eventually prevail but the market hates uncertainty. Dow futures are pointing to a gap down of more than 60 points at the open. If the Bears take over, we could see failure patterns develop at market highs. Not good! If the Bulls step up to the plate and defend, we could strength in the rally.
The big question is, are you willing to speculate that you know the direction and willing to risk capital? For me, the answer is no. I will stand aside from entering new trades until price shows me clues of direction and then I will follow the winning team with higher probability trades. We don’t have to take every day to be successful traders. Also, we don’t have to pick exact tops and bottoms to be profitable.
[button_2 color=”green” align=”center” href=”https://youtu.be/jdJZV-e6Xzg”]Morning Market Prep Video[/button_2]Trade Wisely,
Doug