Janet Yellen Speaks today – Market Up or Down?

Janet Yellen Speaks today – Market Up or Down?

Janet Yellen Speaks today – Market Up or Down?(It’s Friday) Janet Yellen speaks today – will the market be up or down?  I don’t know about you, but I have no darn clue, so let’s wait and see. It might be a good time to take a look at your trading plan, at least until Miss Janet starts to talk. A personal trade plan is essential to trading wealth and Fridays are a good day to evaluate your trade plan. Do you have a 12-month goal? Do you know how much per trade, per week so you need to meet the 12-month goal? Do you know what trade set ups are best for you? We have found from our coaching that those that live by a trade plan profit more money and have a much higher success rate of increasing their wealth.

Friday is the day we count our money and reflect on our weeks trading. How did we do? How can we improve? Take time today to pause on trading and consider education. Reevaluate your trading goals, are your goals on track?

Good Trading – Hit and Run Candlesticks


Learn more about Hit and Run Candlesticks, and today’s trade idea and plan plus the 10 or more members trade ideas, starting at 9:10 EST AM every morning. Every day we teach and trade using the T-Line, Candlesticks, Support and Resistance, Trends, chart patterns and continuation patterns.

Trade  Updates – Hit and Run Candlesticks

Not much changed from yesterday – we still have a couple longs and a couple shorts. We really aren’t interested into much until the market is more in our favor.

Are you having trouble putting together a winning trade? Not sure what scans to use? So near to having multiple winning trades, but something always goes wrong. Maybe a couple hours with a trading coach could make all the difference in the world. Hit and Run Candlesticks has 4 trading coachesLearn More about the Coaches

With on-demand recorded webinars, eBooks, and videos, member and non-member eLearning, plus the Live Trading Rooms, there is no end your trading education here at the Hit and Run Candlesticks, Right Way Options, Strategic Swing Trade Service and Trader Vision.


Eyes on The Market

I follow the T-Line and the 34-ema regularly, and the combination is flashing warning signs. The SPY, IWM, and the transports all show the T-Line to be below the 34-EMA and any weakness in the QQQ’s today might push the T-Line over. Of course, Janet Yellen is to speak today, and that could change everything. My plan today will be to sit tight and wait.

What is a Trade Idea Watch-list?

A trade idea watchlist is a list of stocks that we feel will move in our desired direction over a swing trader’s time frame.  That time could be one to 15 days for example. From that watch list, we wait until price action meets our conditions for a trade.

Rick’s personal trade ideas for the day MEMBERS ONLY

Start your education with wealth and the rewards of a Swing Traders Life – Click Here


Investing and Trading involve significant financial risk and are not suitable for everyone. No communication from Hit and Run Candlesticks Inc. is financial or trading advice. All information is intended for Educational Purposes Only. Terms of Service.

Rick Saddler is not a licensed financial adviser nor does he offer trade recommendations or advice to anyone except for the trading desk of Hit and Run Candlesticks Inc.


FB – Bullish Over $171.30 With The Bull Flag

FB – Bullish Over $171.30 With The Bull Flag

FB – Bullish Over $171.30 With The Bull FlagFB – Bullish over $171.30 with the Bull Flag. FB has seen a nice bullish run with a pullback that is currently holding the $164.30 support line. A breakout of the upper flag line would set FB up to test the recent high and then possibly $180-$190 area. A little bullish help from the market would help – Remember not to force a trade. You don’t work for the trade – the trades work for you.

Good Trading – Hit and Run Candlesticks

Learn more about Hit and Run Candlesticks, and today’s trade idea and plan plus the 10 or more members trade ideas, starting at 9:10 EST AM every morning. Every day we teach and trade using the T-Line, Candlesticks, Support and Resistance, Trends, chart patterns and continuation patterns.

Trade Updates – Hit and Run Candlesticks

Added another long to the trade portfolio so now we are long 4 positions and short 2

Are you having trouble putting together a winning trade? Not sure what scans to use? So near to having multiple winning trades, but something always goes wrong. Maybe a couple hours with a trading coach could make all the difference in the world. Hit and Run Candlesticks has 4 trading coachesLearn More about the Coaches

With on-demand recorded webinars, eBooks, and videos, member and non-member eLearning, plus the Live Trading Rooms, there is no end your trading education here at the Hit and Run Candlesticks, Right Way Options, Strategic Swing Trade Service and Trader Vision.


RACE – You would be up 37.28%% or $3140.00

If you bought 100 shares when we posted to our members on May 19. Hit and Run Candlesticks members practice trade management and trade planning with Price and Candlesticks, The T-line, Trend, Trend Lines, Chart Patterns, Support, and Resistance.
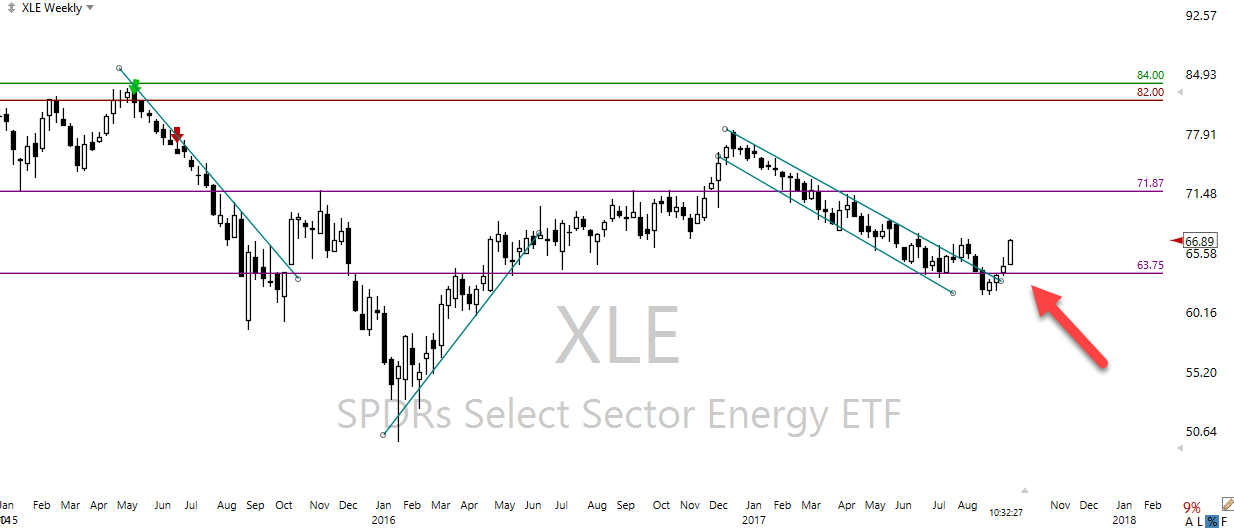
 

Eyes On The Market (SPY)

With yesterday’s inside day Doji close it would seem the buyers and sellers are still at undecided on a Bullish Breakout or to continue the trend down. With the T-Line below the 34-ema, I must give the game to the sellers, and the buyers are fighting like crazy. Price the most important player on the field is still below the major trend line and below the T-Line and the Bulls have not broken the Lower High Lower Low cycle. We are keeping our inverse ETF list handy.


What is a Trade Idea Watch-list?

A trade idea watchlist is a list of stocks that we feel will move in our desired direction over a swing trader’s time frame.  That time could be one to 15 days for example. From that watch list, we wait until price action meets our conditions for a trade.

Rick’s personal trade ideas for the day MEMBERS ONLY

Start your education with wealth and the rewards of a Swing Traders Life – Click Here.


Investing and Trading involve significant financial risk and are not suitable for everyone. No communication from Hit and Run Candlesticks Inc. is financial or trading advice. All information is intended for Educational Purposes Only. Terms of Service.

Rick Saddler is not a licensed financial adviser nor does he offer trade recommendations or advice to anyone except for the trading desk of Hit and Run Candlesticks Inc.


Bulls and Bears in a dead heat at resistance.

Bulls and Bears in a dead heat at resistance.

resistanceAt the open yesterday, it appeared that the Bears were taking control, but Bulls fought back with equal vigor.  As a result, the day ended with the Bull and Bears locked in a virtual dead heat.  All the major indexes, however, remained under resistance and short-term downtrends remain in tact.  A stalemate just below resistance is not the place to be actively adding risk.  Always remember anything is possible and don’t assume you can predict the outcome.  If you do decide to trade, I suggest keeping positions smaller than normal until you see the Bulls gaining the upper hand.  Also, have a plan to protect current profits and cut losses quickly if the Bears gain the upper hand.

On the Calendar

We kick off the Thursday Economic Calendar with the Weekly Jobless Claims number at 8:30 AM Eastern.  Normally we would have seen an increase in Jobless numbers this time of year due to the annual auto retooling.  However, this year claims have held steady at historic low levels.  Forecasters are expecting to see an increase this week to 237K vs. 232K on the last reading.  At 10:00 AM we get a reading from Existing Home Sales which are expected to rise to 5.565 million annualized rate vs. the 5.520 in the last report.  After that, we have a few reports that are very unlikely to influence the market and a bunch of bill/note announcements.

On the Earnings Calendar, we have nearly 80 companies expected to report today.  Retailers play a prominent role today with reports from ANF, BURL, DLTR, FLWS, and SHLD all reporting before the bell.  It’s been a rough quarter for retail so let’s hope we can begin to see that trend change today.

Action Plan

After the morning gap down the Bull attempted a rally but near resistance levels, they seemed equally matched by the Bears.  Sideways choppy price action most of the day was the result.  Resistance levels continue to hold as does the newly developed technical downtrend.  Currently, futures are pointing to a slightly higher open, but as of now, it appears to be less than yesterdays highs.  Perhaps today’s economic and earnings data will provide some directional inspiration after the open.

Currently, I am holding some nice gains in several positions and yesterday during the daily live session I picked up a few DIA and SPY puts.  Please understand I am not trying to predict the market is about to fall with the put purchase.  I am merely adding a little hedge to lower my long exposure to the market.  As we approach the weekend, I will have a focus on taking some profits.  With the overall market testing resistance, I will also be very focused on price action.  I want to be prepared to act if the Bulls break through resistance or if the Bears gain the edge on this battle ground.

[button_2 color=”green” align=”center” href=”https://youtu.be/I_BBPBWDQ-8″]Morning Market Prep Video[/button_2]

Trade Wisely,

Doug

Relief rally, not a game changer yet.

Relief rally, not a game changer yet.

game changerYesterday it was nice to have such a strong bullish move and relieve some of the bearish pressure.  Unfortunately, the relief rally was not a game changer.  The indexes closed the day below resistance levels and continued to remain under the current downtrends.   The Bulls still have a lot of work to do if they are to regain control and I suspect the Bears still have some fight in them.

A mistake I used to make was to focus too closely on the hard right edge of the chart.  Yesterdays, bullish move would have me tossing caution to the wind, and I would buy stocks with both hands severely over trading the market condition.  If the market turned, I would suffer big losses damage not only my account but also crush my confidence as a trader.  My suggestion, if you do trade, consider smaller than normal positions to control the risk.  Also be mentally prepared to exit trades quickly should the market begin to turn against you.  Be willing to take small gains and cut off losses quickly if you suddenly find yourself on the wrong side of the battlefield.

On the Calendar

The hump day Economic Calendar kicks off at 9:45 AM with the PMI Composite Flash report.  The consensus is expecting a moderate but constructive growth with services continuing to outpace manufacturing.  At 10:00 AM we get the latest reading on New Home Sales which forecasters are expecting to remain flat at the July 610K print.  10:30 AM the very important EIA Petroleum Status Report.  The last reading showed a decline in inventories, but crude continues to struggle under selling pressure.  There is no forecast for this number, so all we can do is wait and hope it will continue to decline and supporting prices.

The Earnings Calendar has just over 50 companies reporting 3rd quarter results.  There are several details in the list today with LOW being the most notable and heavily watched.  LOW will report before the bell.

Action Plan

Yesterday all the major indexes caught a relief rally that was quite strong and leaving behind an open gap.  The DIA, SPY and QQQ’s, all left behind a candle pattern loosely interpreted as a Morning Star.  As good as that would seem the indexes are still not out of danger.  First, this pattern requires follow-through. Price action to be valid.  Secondly, all the indexes closed below. Short-term down trends as well price resistance.  The questions now, will the Bulls have the moxie to push through the resistance?  I suspect the Bears will have something to say about that mounting a defense.  It should be an interesting battle.

Currently, the futures are pointing to a lower open which is not a surprise after such a big move.  There are a lot of good charts flashing buy signals after yesterdays move.  While I am long the market, I want to remain very cautious.  For me, that means I want to be careful to not over trade during this market condition.  I will normally begin with smaller than normal positions to reduce my risk.  I will also be prepared to take any profits much faster should the overall market show clues of failure.  If the Bears happen to regain control, a very quick sell off is possible, so plan accordingly and remain focused on the price action after the open.

Trade Wisely,

Doug

APRI – T-Line Run Flag Pullback

APRI – T-Line Run Flag Pullback

APRI – T-Line Run Flag PullbackAPRI – A T-Line Run Flag Pullback is trending and recently broke out of the $1.48 resistance line and has now pulled back on Bullish profit taking. Price has also pulled back while staying above the V-Stop. Price has also cleared the Dotted Duece and may be ready to take on the 200-SMA. We will be using the Rounded Bottom Breakout Strategy. Until the price is over the 200-SMA.

Good Trading – Hit and Run Candlesticks

Learn more about Hit and Run Candlesticks, and today’s trade idea and plan plus the 10 or more members trade ideas, starting at 9:10 EST AM every morning. Every day we teach and trade using the T-Line, Candlesticks, Support and Resistance, Trends, chart patterns and continuation patterns.

Trade Updates – Hit and Run Candlesticks

Added another long to the trade portfolio so now we are long 4 positions and short 2

Are you having trouble putting together a winning trade? Not sure what scans to use? So near to having multiple winning trades, but something always goes wrong. Maybe a couple hours with a trading coach could make all the difference in the world. Hit and Run Candlesticks has 4 trading coachesLearn More about the Coaches

With on-demand recorded webinars, eBooks, and videos, member and non-member eLearning, plus the Live Trading Rooms, there is no end your trading education here at the Hit and Run Candlesticks, Right Way Options, Strategic Swing Trade Service and Trader Vision.


OSUR – You would be up 72.97%% or $880.00

If you bought 100 shares when we posted to our members on March 23. Hit and Run Candlesticks members practice trade management and trade planning with Price and Candlesticks, The T-line, Trend, Trend Lines, Chart Patterns, Sup

port, and Resistance.

[button_1 text=”Learn%20The%20Life%20Of%20A%20Swing%20Trader” text_size=”32″ text_color=”#000000″ text_font=”Open Sans;google” text_bold=”Y” text_letter_spacing=”0″ subtext_panel=”Y” subtext=”Limited%20Time%20Offer%20-%20Annual%20Membership%2015%25%20Discount” subtext_size=”20″ subtext_color=”#e60acd” subtext_font=”Open Sans;google” subtext_letter_spacing=”0″ text_shadow_panel=”N” styling_width=”40″ styling_height=”30″ styling_border_color=”#000000″ styling_border_size=”1″ styling_border_radius=”6″ styling_border_opacity=”100″ styling_gradient_start_color=”#ffa035″ styling_gradient_end_color=”#ffa035″ drop_shadow_panel=”N” inset_shadow_panel=”N” align=”center” href=”https://ob124.infusionsoft.com/app/orderForms/Hit-and-Run-Candlesticks-Annual-Membership-65025″ new_window=”Y”/]


Eyes On The Market (SPY)

We did get relief bounce as we thought we would and a darn good one at that. Unfortunately, it did not close over major resistance, so the Bulls have a great deal more work to do. The upper down trend line is still in play for the sellers and price is still above the cl

oud on a Morning Star signal (2-Day) chart. The sellers have the upper hand as far as the market goes as we start the day. There are many individual long trades that look great. But we are going to keep our inverse ETF list handy.

What is a Trade Idea Watch-list?

A trade idea watchlist is a list of stocks that we feel will move in our desired direction over a swing trader’s time frame.  That time could be one to 15 days for example. From that watch list, we wait until price action meets our conditions for a trade.

Rick’s personal trade ideas for the day MEMBERS ONLY

Start your education with wealth and the rewards of a Swing Traders Life – Click Here.


Investing and Trading involve significant financial risk and are not suitable for everyone. No communication from Hit and Run Candlesticks Inc. is financial or trading advice. All information is intended for Educational Purposes Only. Terms of Service.

Rick Saddler is not a licensed financial adviser nor does he offer trade recommendations or advice to anyone except for the trading desk of Hit and Run Candlesticks Inc.


Finding and Trading The T-Line Bounce

Finding and Trading The T-Line Bounce

Finding and Trading The T-Line BounceIn tonight’s e-Learning 8-22-2017 we will discuss the current state of the market, charts and Rick will share a  scan that are tending with a run of 10% and near the T-Line. The recipe for a winning trade is to follow your plan and the best tools for you. We feel a few of the best tools are: Price Action, Candlesticks, Support and Resistance, Trend Lines, Chart Patterns.

Thank you, Ed Carter

For taking an idea and making it work. Ed created the scan for TC2000 and TOS that I have been using to narrow my search and look for a specific chart pattern. Sorry, it’s not the Golden Goose, you still have to do the work.


T-Line Bounce / TC2000 

This scan looks for a stock that has been trending for at least a month. In

that time it will have run up at least 10%.  On top of these conditions, it

finds stocks that have bounced up off the T-line in the last 4 days.


Bullish
——————————————————————————-
TC2000

(((C3 – C25) / C25) > .10) and
C > XAVGC8 and
( ((L – XAVGC8) * .06) or
((L1 – XAVGC8) * .06) or
((L2 – XAVGC8) * .06) or
((L3 – XAVGC8) * .06) )


——————————————————————————-
TOS

# Bouncing Off T-line
# Written by Rick Saddler
# Converted to TOS by Ed Carter
#
def C = close;
def L = low;
def XAVGC8 = ExpAverage(close, 8);
#
plot TlineBounce = (
(((C[3] – C[25]) / C[25]) > .10) and
( ((L – XAVGC8) * .06) or
((L[1] – XAVGC8) * .06) or
((L[2] – XAVGC8) * .06) or
((L[3] – XAVGC8) * .06) ) and
C > XAVGC8
);


Bearish
——————————————————————————-
TC2000

(((C25 – C3) / C3) > .10) and
C < XAVGC8 and
((H  – XAVGC8) * .06) or
((H1 – XAVGC8) * .06) or
((H2 – XAVGC8) * .06) or
((H3 – XAVGC8) * .06)


——————————————————————————-
TOS

# Bouncing Off T-line Bearish
# Written by Rick Saddler
# Converted to TOS by Ed Carter
#
def C = close;
def H = high;
def XAVGC8 = ExpAverage(close, 8);
#
plot TlineBounce = (
((((C[25] – C[3]) / C[3]) > .10) and
C < XAVGC8 and
((H  – XAVGC8) * .06) or
((H[1] – XAVGC8) * .06) or
((H[2]- XAVGC8) * .06) or
((H[3] – XAVGC8) * .06)
);


Are you having trouble putting together a winning trade? Not sure what scans to use? So near to having multiple winning trades, but something always goes wrong. Maybe a couple hours with a trading coach could make all the difference in the world. Hit and Run Candlesticks has 4 trading coachesLearn More about the Coaches

With on-demand recorded webinars, eBooks, and videos, member and non-member eLearning, plus the Live Trading Rooms, there is no end your trading education here at the Hit and Run Candlesticks, Right Way Options, Strategic Swing Trade Service and Trader Vision.


Investing and Trading involve significant financial risk and are not suitable for everyone. No communication from Hit and Run Candlesticks Inc. is financial or trading advice. All information is intended for Educational Purposes Only. Terms of Service.

Rick Saddler is not a licensed financial adviser nor does he offer trade recommendations or advice to anyone except for the trading desk of Hit and Run Candlesticks Inc.


Can the Bulls repair the technical damage?

Can the Bulls repair the technical damage?

technical damageWhile many traders are focused on the what will happen today, I am honestly more concerned with the overall technical damage in the charts.  Today we may bounce, but the big questions are will the Bulls have the energy to repair the price damage.  If we do rally, I will be keenly focused on the on the price action as we approach resistance levels.  In my heart of hearts, I want the Bulls to remain in control and buy the dip, but I won’t risk my money on hope or guesses.  I will need to see proof, and that may take a little time to develop.  Twenty-seven years experience has taught me that there is no need to rush.  If I can control my emotions, wait and watch, I get better trades, and my win/loss ratio can continue to average around 70%.  You don’t have to trade every day to be a successful full-time trader!

On the Calendar

Tuesdays Economic Calander is another very light one.  At 9:00 Am Eastern is the FHFA House Price Index followed by the Richmond Fed Manufacturing Index at 10:00.  Both are really not-consequential reports having little chance of moving the market.  Rounding out the calendar day is a 4-week bond auction.

Over 60 companies grace the Earnings Calendar today with their quarterly results.  INTU, MOMO, and TOL, CRM and AABA may be extra notable for some of the members. Make sure you are checking the reporting date of all companies that affect your portfolio.

Action Plan

As I was out playing with telescopes and photographing the eclipse yesterday, I was not following along intraday as normal.  Although the DIA failed the 50-day average during the day making a new low the Bull managed to stage enough of a rally to recover price and close above this important support level.  The SPY, QQQ’s and the IWM all staged a late day rallies but remain under key moving averages.  I suspect the market will bounce and the current futures are pointing to a slight gap up.  However, other than the DIA the indexes are in a precarious position.  Any rally back toward resistance levels could produce failure patterns continuing the current downtrends.

As you all know, I try to avoid prediction of any kind.  I simply want to follow price when evidence of direction supported by actual buyers or sellers.  As a result, I will likely give the market 20 to 30 minutes to digest the morning rush before making any trading decisions today.  Of course, the top order of business is to manage current positions protecting profits and trading capital.

[button_2 color=”green” align=”center” href=”https://youtu.be/zYmTDGJdBeM”]Morning Market Prep Video[/button_2]

Trade Wisely,

Doug