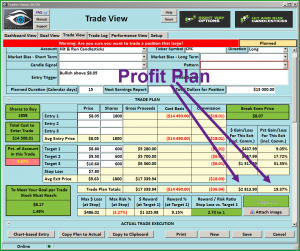
BAS – Bullish T-Line Run PBO

BAS – Bullish T-Line Run PBO

BAS – Bullish T-Line Run PBO(Basic Energy Service INC) $BAS Bullish T-Line Run PBO. BAS starterd it’s reversal with a Hammer on the daily chart or a Bullish Morning Start on the 2-day chart. The T-Line Run went to the 50-sma followed buy a PBO (Pull Back Opportunity) BAS is now a RBB stratagy with a Bullish Inverted Head and Shoulders and still a T-Line Run.

Learn more about Hit and Run Candlesticks, and today’s trade idea and plan plus the 10 or more members trade ideas, starting at 9:10 EST AM every morning. Every day we teach and trade using the T-Line, Candlesticks, Support and Resistance, Trends, chart patterns and continuation patterns.

Trade Updates

We sold DEPO yesterday for a 6.05 loss, and we are still holding IPI +23.56% and HIIQ 18.38% We have 3 more about to become double digit trades.

What would you do with 2-3 or even 4 double-digit trades every week? Education on how to manage a trade from start to finish is key to a swing traders profits.

With on-demand recorded webinars, eBooks, and videos, member and non-member eLearning, plus the Live Trading Rooms, there is no end your trading education here at the Hit and Run Candlestick, Right Way Option, Strategic Swing Trade Service and Trader Vision.


$CAR was first presented to HRC members on June 1,

With a 3.92% move yesterday the total  now 42.55%. Another case of knowing how to manage a chart with Candlesticks, The T-Line, and Support and resistance.


Eyes On The Market

Over all the market is bullish, price leading the T-Line and support doing its job as of yesterday. 2 ETF’s that might help with the market overview is (VTI) Total Stock Market ETF and (VT) Total World ETF. IWM finally broke out.

What is a Trade Idea Watch-list?

A trade idea watchlist is a list of stocks that we feel will move in our desired direction over a swing trader’s time frame.  That time could be one to 15 days for example. From that watchlist, we wait until price action meets our conditions for a trade.

MEMBERS ONLY


Investing and Trading involve significant financial risk and are not suitable for everyone. No communication from Hit and Run Candlesticks Inc. is financial or trading advice. All information is intended for Educational Purposes Only. Terms of Service.

Rick Saddler is not a licensed financial adviser nor does he offer trade recommendations or advice to anyone except for the trading desk of Hit and Run Candlesticks Inc.


Bullishness or Irrational Exuberance?

Bullishness or Irrational Exuberance?

Irrational ExuberanceThere is a very thin line between a bullish market and irrational exuberance.  After the 9th day of rallying straight up, I’m not predicting irrational bullish behavior, but it would be foolish to think this kind of price action will continue forever.  Good earnings reports could continue to encourage buyers to pile on, and exuberance can continue much longer than anyone would expect.  So what is a responsible trader to do?  Trade with a plan!  It is only with a plan and the discipline to follow it that you can avoid predicting and emotional trading.  HRC and RWO have proved over and over that planning makes the difference in profiting consistently.  If you’re not planning I have to ask, What are you waiting for, an engraved invitation?

On the Calendar

The Thursday Economic Calendar begins with the Weekly Jobless Claims and the Philadelphia Fed Business Outlook Survey at 8:30 AM Eastern.  Labor demand remains very strong, and forecasters see jobless claims falling by 1000 to 246K last week.  Growth in the factory sector has been exceptional in the Philadelphia Fed index. The index came in at 27.6 in June with the July consensus at 22.0. Order readings are at extraordinary levels and points to an overheating at least in the Philly sample.  Leading indicators are at 10:00 AM, and after that, there is a pile of bill and note announcements.

Today is the first big day of the 3rd quarter Earnings Calendar with 128 companies expected to report today.  Some of the notable reports would be EBAY, MSFT, KEY, and V.  Make sure you are checking current holdings and potential new trades for earnings dates as part of your daily planning.

Action Plan

The Bulls showed some incredible strength yesterday stampeding higher with no fear.  The SPY was the strongest of the indexes with buying right into the close and yet another all time record high.  Bullish buyers even lifted the IWM which has lagged behind the rest of the market to new all time record highs.  With the 9th straight day of gains, even the QQQ’s managed a new record high close having sliced through multiple layers of price resistance as if they were never there.

To me, the overall market seems to be displaying irrational bullishness.  That can continue as buyers continue to pile in feeling as if they are missing out.  However blind bullishness can also create some very nasty reversals.  Make sure you are protecting your profits and have a plan on every trade in case the market suddenly turns.  I will likely be more focused on taking profits today and tomorrow than looking for new trades in an over extended rally.  Having said that there are so many great looking charts setting up.  If earnings continue to attract buyers, it is entirely possible this rally can extend even more but if you do trade make sure you entering low-risk trades rather than chasing trades already will within their run higher.

[button_2 color=”green” align=”center” href=”https://youtu.be/l-pq2Df_o-4″]Morning Market Prep Video[/button_2]

Trade Wisely,

Doug

CZR And The Bullish J-Hook Continuation Pattern

CZR And The Bullish J-Hook Continuation Pattern

CZR And The Bullish J-Hook Continuation Pattern(Caesars Entertainment Corp) $CZR and The Bullish J-Hook Continuation Pattern Breakout is easy to spot and easy to trade with a trading plan. The 34-ema has been trending while price pulled back to the 50-sma, printed a Bullish Piercing candle followed by a Bullish T-Line Run. Yesterday cleared resistance for the next leg. The 2-Day chart printed a Bullish Morning Star signal on the PBO support line.Learn more about Hit and Run Candlesticks, and today’s trade idea and plan plus the 10 or more members trade ideas, starting at 9:10 EST AM every morning. Every day we teach and trade using the T-Line, Candlesticks, Support and Resistance, Trends, chart patterns and continuation patterns.

Trade Updates

We sold ADRX yesterday for a double digit profit, and we are still holding IPI and HIIQ both double digits.We are still holding IPI +20.08 ARDX +21.59%

What would you do with 2-3 or even 4 double-digit trades every week? Education on how to manage a trade from start to finish is key to a swing traders profits.

With on-demand recorded webinars, eBooks, and videos, member and non-member eLearning, plus the Live Trading Rooms, there is no end your trading education here at the Hit and Run Candlestick, Right Way Option, Strategic Swing Trade Service and Trader Vision.


$FOLD was first presented to HRC members on June 1,

With a 7% move yesterday the total  now 72%. Another case of knowing how to manage a chart with Candlesticks, The T-Line, and Support and resistance.


Eyes On The Market

Over all the market is bullish, price leading the T-Line and support doing its job as of yesterday. 2 ETF’s that might help with the market overview is (VTI) Total Stock Market ETF and (VT) Total World ETF.

What is a Trade Idea Watch-list?

A trade idea watchlist is a list of stocks that we feel will move in our desired direction over a swing trader’s time frame.  That time could be one to 15 days for example. From that watchlist, we wait until price action meets our conditions for a trade.

MEMBERS ONLY

Investing and Trading involve significant financial risk and are not suitable for everyone. No communication from Hit and Run Candlesticks Inc. is financial or trading advice. All information is intended for Educational Purposes Only. Terms of Service.

Rick Saddler is not a licensed financial adviser nor does he offer trade recommendations or advice to anyone except for the trading desk of Hit and Run Candlesticks Inc.
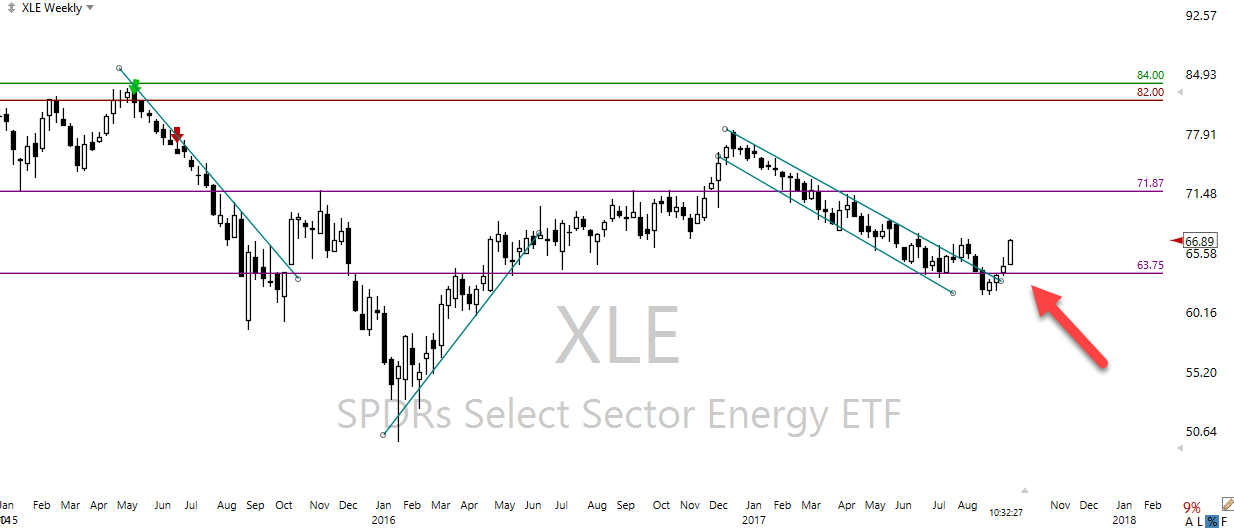
 

The Bulls showed strength defending the rally.

The Bulls showed strength defending the rally.

Bulls showed strengthAt the market, I was concerned that the Bears were taking over, but the Bulls showed strength, stepping up and defending the rally.  The SPY and the QQQ’s displayed remarkable strength continuing to move up into the close.  Currently, the bull run is getting a little over baked with eight days up, however, if earnings reports continue to provide the market confidence that can continue.  If we stay objective setting aside personal biases and simply focus on price action, we can identify and follow the directional clues.  Follow don’t predict!

On the Calendar

The hump day Economic Calendar begins with Housing Starts at 8:30 AM.  Last week the housing starts and permits were noticeably weak last month coming in just over a 1 million annualized rate.  Forecasters are expecting a big rebound this month bringing the annualized number up to a rate of 1.170.  At 10:30 we have the EIA Petroleum Status Report that has become heavily watched by traders the last couple years.  Inventories have been falling for several months now, and we need that to continue to stabilize oil pricing.  If we happen to get an increase in supply, we can expect an overall negative reaction by the market.

On the Earnings Calendar, we have 81 companies reporting earnings today.  There are few companies that report before the bell, but the biggest reports will be after the close today with the likes of AXP and QCOM.  Stay on your toes as we ramp up and make sure you check when companies report or suffer the consequences.

Action Plan

After a quick morning plunge, the Bulls went back to work showing they want to defend support levels.  The DIA has the most dramatic move of the day leaving behind a Hammer pattern above price support.  Keep in mind a Hammer requires follow-through.  The SPY managed to squeak out yet another record closing high on its end of day bullish push while IWM remained under price resistance.  The continued strength in the QQQ’s was nice however the rally is nine days old, and a pullback or consolidation could begin at any time.

Futures are currently suggesting a slightly lower open, but there are still some big reports to come, so anything is possible.  We have some fantastic gains in our RWO trades, so the first order of business will be to manage these positions.  I will be looking for new positions today, but once again I will likely give the market 15 to 30 minutes focusing on the price action before making any decisions.

[button_2 color=”green” align=”center” href=”https://youtu.be/VNwAhz3BEzY”]Morning Market Prep Video[/button_2]

Trade Wisely,

Doug

Slow yet constructive price action.

Slow yet constructive price action.

constructive price actionThe market was a bit slow yesterday, but I saw as very constructive price action.  While it’s true the indexes chopped in a rather small range yesterday, it seemed only to be resting after the rally.  Perhaps both the Bulls and Bears are just pausing ahead of big earnings reports to give them some directional inspiration.  Whatever the case may be, it is our job as traders, to maintain discipline.  Avoid the emotional drama of the season.  Focus on the price action react by following it rather than trying to predict it.

On the Calendar

Tuesdays Economic Calendar has three importing reports, but they are unlikely to move the market unless they come in with a big surprise.  At 8:30 AM Eastern we have Import Export Prices.  Follow by the Housing Market Index and Treasury International Capital at 10:00 AM and 4:00 PM respectively.  Import Export number is expected to decline by 0.2% in largely on the back of low energy prices.  The future housing sales expectations are expected to remain strong.  Forecasters see it ticking higher this month from 67 to 68 on the Housing Market Index.  The Treasury International Capital number tracks foreign demand for Long-Term Us securities.  It normally fluctuates with the strength of the U.S Dollar.

On the Earnings Calendar, we have 45 companies reporting today.  Noteworthy reports will form GS, BAC, JNJ, and PGR before the market opens.  IBM which has been under a lot of selling pressure since Buffett lost confidence in the company reports after the bell today.

Action Plan

Although yesterday was a pretty slow day with the market taking a bit of rest, it was still very constructive day.  Price action was somewhat choppy, but Bulls maintained their position of control.  The QQQ’s is the only index showing stress leaving behind a Shooting Star Pattern right a price resistance.  IWM once again threatened a breakout pushing hard against resistance, but once again it proved to be too strong preventing a breakout.

As I write this, futures are slightly higher, but the direction of the market will be directly impacted by big earnings reports this morning.  The truth is anything is possible, so it’s important to remain flexible and set aside personal biases.  Don’t predict just follow the price action as it presents itself.  There are a lot of good charts showing bullish setups this morning.  However, I want to avoid the drama of the open and will likely allow 15 to 30 minutes of price action to occur before making any new trade decisions today.

[button_2 color=”green” align=”center” href=”https://youtu.be/sZF6nQODcuE”]Morning Market Prep Video[/button_2]

Trade Wisely,

Doug

VSTM Is Pulling Back To Our T-Line

VSTM Is Pulling Back To Our T-Line

VSTM Is Pulling Back To Our T-Line(Verastem Inc) $VSTM is pulling back to our T-Line, and the V Stop support dots on lower volume. $VSTM broke out a few days ago (3-day chart a flag breakout)and now set up for a possible buy signal; we have VSTM on our trade watch-list for an entry and swing trade.

Learn more about Hit and Run Candlesticks, and today’s trade idea plus the 10 or more members trade ideas, starting at 9:10 EST AM every morning. Every day we teach and trade using the T-Line, Candlesticks, Support and Resistance, Trends, chart patterns and continuation patterns.

We are still holding IPI +20.08 ARDX +21.59%

What would you do with 2-3 or even 4 double-digit trades every week? Education on how to manage a trade from start to finish is key to a swing traders profits.

With on-demand recorded webinars, eBooks, and videos, member and non-member eLearning, plus the Live Trading Rooms, there is no end your trading education here at the Hit and Run Candlestick, Right Way Option, Strategic Swing Trade Service and Trader Vision.


$AGEN was first presented to HRC members on July 5,

Now up 15% with a 5% run yesterday The Rounded Bottom Breakout pattern target direction is the 200-sma and leads to a breakout of the 200-sma a great many times. AGEN is now in a continuation pattern with the 200-sma supporting the move.

Eyes On The Market

After 3 Bullish bars, the doji yesterday is signaling a day of rest. The overall market is still signaling the bulls have control. The 3-Day chart on the SPY is showing a Bullish Engulf Flag Breakout with following through – Bullish pattern

What is a Trade Idea Watch-list?

A trade idea watchlist is a list of stocks that we feel will move in our desired direction over a swing trader’s time frame.  That time could be one to 15 days for example. From that watchlist, we wait until price action meets our conditions for a trade.

MEMBERS ONLY

Investing and Trading involve significant financial risk and are not suitable for everyone. No communication from Hit and Run Candlesticks Inc. is financial or trading advice. All information is intended for Educational Purposes Only. Terms of Service.

Rick Saddler is not a licensed financial adviser nor does he offer trade recommendations or advice to anyone except for the trading desk of Hit and Run Candlesticks Inc.