What a difference a day makes!

What a difference a day makes!

What a difference a day makes!The ugly whipsaw yesterday took the market over confidence to the wood shed and beat it half to death.  What a difference a day makes!  In my note yesterday I wrote the importance of having a plan for a reversal that could happen at any time.  I also mentioned the dangers of over-trading an extended rally.  Believe me; I understand how easy it is to get caught up in an extended rally.  A mistake I made over and over for years.  Being prepared for a possible reversal is not an act of bearishness.  It’s simply a responsible and disciplined act of good business practices.  We can not predict the time and date of such price action but can prepare a plan on how to deal with it and avoid poor emotional decision making in the heat of battle.

On the Calendar

The last Friday of the July begins with a very importing number on the Economic Calendar.  The final estimate of the 2nd quarter GDP releases at 8:30 AM Eastern.  Consensus suggests it will come in with a solid 2.6% annualized rate with retail sales leading the way.  Keep in mind the GDP number can move the market.  Out at the same time is the Employment Cost Index which jumped up 0.8% in in the 1st quarter but the forecasters see that slowing slightly with a reading today expected at 0.6%.  Consumer Sentiment is at 10:00 AM and is expected to show continued strength with a reading of 93.1.  After that, the only thing of note is a Fed speaker at 1:20 PM this afternoon.

On the Earnings Calendar, there are about 100 companies expected to report today.  Stay on your toes and continue to check earnings dates for companies you hold or are thinking of buying.

Action Plan

Yesterdays whipsaw should not have been a surprise to RWO readers.  We can never know the date and time when something like this will occur but as I have been saying, prepare, because the possibility exists.  Gap up’s to new market highs should always put us on high alert for the possibility of whipsaw price action.  The VIX at historic lows only adds to the high alert status.

The whipsaw made a mess of a lot of charts, and I suspect could be a warning of higher volatility days to come.  Choppy markets are dangerous and very difficult to trade.  It may be wise to curtail trading activity until we get better clues on direction.  There is also a mix of signals in the Index charts raising some concern.  The DIA managed a full recovery closing at a new record high.  However, the SPY and the QQQ closed with ugly bearish engulfing candles although well off the day’s low.

Futures were negative all night but have recovered slightly in the early premarket.  Toss in the Senate’s failure on the health care bill, and the AMZN earnings miss and explosive volatility could be the result.  Overall the trend continues to be up, but I will not likely seek to add new risk ahead of the weekend with such price action confusion.  I will, however, be very focused on managing current positions and taking profits where possible to reduce exposure to the market.

[button_2 color=”green” align=”center” href=”https://youtu.be/JQY8fX5FIYo”]Morning Market Prep Video[/button_2]

Trade Wisely,

Doug


A Good Day To Exercise Caution

A Good Day To Exercise Caution

(It’s Friday) and it’s a good day to exercise caution and protect your hard earned profits. Yikes, the transports (IYT – ETF) had a very bad day yesterday and may be trying to build a Bearish “M” pattern. Price is below the Lower T-Line Band on many times frames. The 200-SMA could act as support, but right now the chart is looking a little angry.

Friday is the day we count our money and reflect on our weeks trading. How did we do? How can we improve? Take time today to pause on trading and consider education. Reevaluate your trading goals, are your goals on track?

Friday’s Open Live Trading Room

Learn more about Hit and Run Candlesticks and check us out in the LIVE TRADING ROOM. ClICK HERE and Choose Room #1 take advantage of our trading room FREE on Friday’s. We talk about past, current and upcoming trades.

Hit and Run Candlesticks Trading Stats Last 30-Days

Below you will find the Hit and Run Candlesticks trading stats for the past 30 days.


Hit and Run Candlesticks Trading Stats Last 30-Days

With on-demand recorded webinars, eBooks, and videos, member and non-member eLearning, plus the Live Trading Rooms, there is no end your trading education here at the Hit and Run Candlestick, Right Way Option, Strategic Swing Trade Service and Trader Vision.


Eyes on The Market

For the past three days, the market has lost interest in moving higher and tested the Daily T-Line intraday. The 4-day chart has printed a Hang-Man Candle and based on the futures this morning we could see a test of the T-Line or even lower. Yesterday also tested the 23.6 Fib line on an intraday pullback based on the recent run. The 38.2 Fib Line is at $244.90, and that is the JUNE high price support.

What is a Trade Idea Watch-list?

A trade idea watch list is a list of stocks that we feel will move in our desired direction over a swing trader’s time frame.  That time could be one to 15 days for example. From that watch list, we wait until price action meets our conditions for a trade.

Monday through Thursday Hit and Run Candlesticks shares with members 10-15 trade ideas for the watch list.


Investing and Trading involve significant financial risk and are not suitable for everyone. No communication from Hit and Run Candlesticks Inc. is financial or trading advice. All information is intended for Educational Purposes Only. Terms of Service.

Rick Saddler is not a licensed financial adviser nor does he offer trade recommendations or advice to anyone except for the trading desk of Hit and Run Candlesticks Inc.

 

T-Line July 25, 2017 Webinar

[video_player type=”embed” width=”560″ height=”315″ align=”center” margin_top=”0″ margin_bottom=”20″]PGlmcmFtZSBzcmM9Imh0dHBzOi8vcGxheWVyLnZpbWVvLmNvbS92aWRlby8yMjcyOTY4OTMiIHdpZHRoPSI2NDAiIGhlaWdodD0iMzYwIiBmcmFtZWJvcmRlcj0iMCIgd2Via2l0YWxsb3dmdWxsc2NyZWVuPSIiIG1vemFsbG93ZnVsbHNjcmVlbj0iIiBhbGxvd2Z1bGxzY3JlZW49IiI+PC9pZnJhbWU+[/video_player]


Earnings fueled rally nearing 3-weeks up. Earnings fueled rally nearing 3-weeks up.

Earnings fueled rally nearing 3-weeks up.

Earnings Fueled RallyThe current rally has been amazing with new records for the books almost every day on this earnings fueled rally.  Hey, who doesn’t love market rally? Right!  Profits are easier to make, and the world of the trader just seems to be filled with sunshine and rainbows.  It’s often times like this when traders get complacent.  Breaking the rules, rushing trades and/or over trading.  If we fail to plan carefully, we invite emotion into our trading which normally ends badly.  Maintain your discipline, be prepared and protect your capital from emotional decisions with a well thought out plan.

On the Calendar

The Economic Calendar begins with Durable Goods this morning at 8:30 AM Eastern time.  Durable goods is a market moving number that has been a little soft with declines in both April and May.  Consensus for this month is to see a big bounce back with an expected increase of 3.5% mostly on the back of the aircraft industry.  Also at 8:30 AM is the International Trade in Goods number as well as the Weekly Jobless Claims.  Trade goods are expected to come in with a 65.0 billion deficit which is an improvement from last month.  Labor has been very strong, but there is an expectation of an increase to 240K from the 233K last reading.  There are a few nonmarket moving reports, auctions and announcements.

Today is a huge day on the Earnings Calendar with nearly 450 companies expected to report results today.  Believe me; it’s in your best interest to check reporting dates before entering new positions.  It is equally important to check on reporting dates within your portfolio.

Action Plan

Yesterday the market pretty choppy which is normal on an FOMC announcement day but all in all the indexes held up pretty well.  Earnings have already begun to roll in this morning with the majority being positive.  Futures are currently reflecting that bullishness pointing to a slightly higher open, but it could shift quickly on the data laden day.  As of right now the QQQ’s are showing yet another gap up open and another record level for the history books.  The DIA and the SPY are not far behind.

As always my top priority is to manage current positions first and as we begin to wind down this trading week taking profits is also high on my list.  I will, however, look for new trades today but much recognize the fact that the rally is nearing the 3-week mark.  I’m not predicting a turn but if one did occur it should not be a big surprise so plan your trading accordingly and always have an exit plan.

[button_2 color=”green” align=”center” href=”https://youtu.be/r1j05s6nb48″]Morning Market Prep Video[/button_2]

Trade Wisely,

Doug

CONN T-Line Run Pop Out Of The Box Pattern

CONN T-Line Run Pop Out Of The Box Pattern

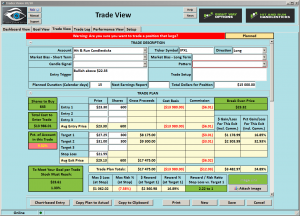
CONN T-Line Run Pop Out Of The Box Pattern(Conn’s Inc) $CONN is a T-Line Run Pop Out of the Box that created a Bullish Kicker back in April then rallied made a few bullish swings then started to consolidate. On July 17 the Bulls made their move breaking out of a Bullish W pattern, after 3 days the box started to form. We have found the Pop Out of The Box a terrific pattern to trade.

Learn more about Hit and Run Candlesticks, and today’s trade idea and plan plus the 10 or more members trade ideas, starting at 9:10 EST AM every morning. Every day we teach and trade using the T-Line, Candlesticks, Support and Resistance, Trends, chart patterns and continuation patterns.

Trade Updates

A quiet day for us yesterday, we closed X for a 10.92% profit – And we bought a gold stock. You can see our 30-day stats below:


What would you do with 2-3 or even 4 double-digit trades every week? Education on how to manage a trade from start to finish is key to a swing traders profits.

With on-demand recorded webinars, eBooks, and videos, member and non-member eLearning, plus the Live Trading Rooms, there is no end your trading education here at the Hit and Run Candlesticks, Right Way Options, Strategic Swing Trade Service and Trader Vision.

CONN T-Line Run Pop Out Of The Box Pattern

[$59.92% CGI] first presented to HRC members on June 19,

59.02% run with the 16.87% pop yesterday. Another chart that has worked out very well for Hit and Run Candlestick Members. Hit and Run Candlesticks members have learned how important it is to use their trading tools, Price with Candlesticks and manage their trades using The T-line, Trend, Trend Lines, Support, and Resistance.


Eyes On The Market

The current course of the market is Bullish; investors see the earnings reports as positive and bullish, so the market rises. Yesterday’s trading was a bit soft, you could feel it in during the day, and the candlestick was soft (not going anywhere). Once again the buyers kept the price above the T-Line. We will continue to share trades with members when we see them come through our scanner.

What is a Trade Idea Watch-list?

A trade idea watchlist is a list of stocks that we feel will move in our desired direction over a swing trader’s time frame.  That time could be one to 15 days for example. From that watch list, we wait until price action meets our conditions for a trade.

See Rick’s personal trade ideas for the day MEMBERS ONLY

Start your education to wealth and the rewards of a Swing Traders LifeClick Here


Investing and Trading involve significant financial risk and are not suitable for everyone. No communication from Hit and Run Candlesticks Inc. is financial or trading advice. All information is intended for Educational Purposes Only. Terms of Service.

Rick Saddler is not a licensed financial adviser nor does he offer trade recommendations or advice to anyone except for the trading desk of Hit and Run Candlesticks Inc.


TRLD Has Constructed A Bullish Inverted Head and Shoulder Pattern

TRLD Has Constructed A Bullish Inverted Head and Shoulder Pattern

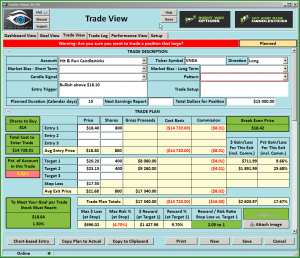
TRLD Has Constructed A Bullish Inverted Head and Shoulder Pattern(Tailored Brands Inc) $TLRD has constructed a Bullish Inverted Head and Shoulder pattern with a Bullish breakout of a double top. TLRD is an (RBB) Rounded Bottom Breakout pattern. Both the T-Line and the 34-ema have turned up and has crossed over the 50-sma. On a 2-day chart, the Bullish Morning Star kicked off the recent rally.

Learn more about Hit and Run Candlesticks, and today’s trade idea and plan plus the 10 or more members trade ideas, starting at 9:10 EST AM every morning. Every day we teach and trade using the T-Line, Candlesticks, Support and Resistance, Trends, chart patterns and continuation patterns.

Trade Updates

Hit and Run Candlesticks closed 2 positions yesterday “IPI + 24.56% and HIIQ + 19.67%to bank profits, remember we can buy them back. Our purpose for Swing Trading is to make money. We have had too many positions in our portfolio. We are currently green on 11 positions and neutral to -3.18% on 7 positions. So far for July, we have close 14 positions for a 71.43%-win rate and ¾ of our account is invested.

What would you do with 2-3 or even 4 double-digit trades every week? Education on how to manage a trade from start to finish is key to a swing traders profits.

With on-demand recorded webinars, eBooks, and videos, member and non-member eLearning, plus the Live Trading Rooms, there is no end your trading education here at the Hit and Run Candlesticks, Right Way Options, Strategic Swing Trade Service and Trader Vision.


$SGMS was first presented to HRC members on March 6,

68% run with the 11.27% pop. Another chart that has worked out very well for Hit and Run Candlestick Members. Hit and Run Candlesticks members have learned how important it is to follow price with Candlesticks and manage their trades using The T-line, Trend, Trend Lines, Support, and Resistance.


Eyes On The Market

The current course of the market is Bullish; the trend continues to rise with Pullback Opportunities along the way. I am sure you already know so just reminding you Miss Janet speaks today which may or may not influence the market, the charts will tell us.

What is a Trade Idea Watch-list?

A trade idea watchlist is a list of stocks that we feel will move in our desired direction over a swing trader’s time frame.  That time could be one to 15 days for example. From that watchlist, we wait until price action meets our conditions for a trade.

See Rick’s personal trade ideas for the day MEMBERS ONLY

Start your education to wealth and the rewards of a Swing Traders LifeClick Here


Investing and Trading involve significant financial risk and are not suitable for everyone. No communication from Hit and Run Candlesticks Inc. is financial or trading advice. All information is intended for Educational Purposes Only. Terms of Service.

Rick Saddler is not a licensed financial adviser nor does he offer trade recommendations or advice to anyone except for the trading desk of Hit and Run Candlesticks Inc.


Plan for an extra dose of volatility.

Plan for an extra dose of volatility.

VolatilityWith hundreds of earnings reports today and the FOMC announcement, we can likely expect volatility to kick up a notch.  Extra volatility should not be feared, but every trader should have a plan in place to deal with it unemotionally.  Please, Please, PLEASE make sure you are checking earnings dates on all stocks.  As an example take a look at AKAM.  AKAM had a beautiful entry signal at the end of the day.  I would normally have bought the stock in a hot minute but checking earnings I discovered it was about to report.  Thankfully I checked because the stock is gapping down almost 8% this morning!  That few seconds likely saved me hundreds of dollars.  Defentally worth the effort!  With VIX so low there are many traders beginning to speculate the market is overbought.  That could be true but trying to predict a top is a very difficult business that normally costs those that do a lot of capital.  If you’re concerned about a market top, lock in profits and reduce trading activity.  The market will tell us where it wants to go if we just wait and watch rather than predict.

On the Calendar

Hump day on the Economic Calendar begins with New Home Sales at 10:00 AM Eastern.  Forecasters see home sales increased slightly to 611k consensus in June.  Then at 10:30 AM we will get the EIA Petroleum Status Report.  Oil supply levels have been trending lower in the EIA report, and continued reductions are very important to stabilize the commodity prices.  Then at 2:00 PM is the all important FOMC Announcement on interest rates.  The market is not expecting a rate increase today but keep in mind that all they have to do is change a word or two in their statement to move the market dramatically.

On the Earnings Calendar, there are 275 companies reporting results today.  As of now, earnings have pushed the market sharply higher with no fear.  Nevertheless, it is extremely important for every trader to find out when the companies they hold are reporting.

Action Plan

Overall we saw the indexes held up pretty well yesterday, but the price action was rather subdued as the market waits to hear from the FOMC.  The bullish trend is still is still in place on a daily and the weekly charts.  The best practice is to continue trading with the trend.

The trend is still up, so I will continue to look for long trades. However, I will be slow to enter new risk at this point in the rally.  Although I have pickup some new trades, I have also been reducing overall risk taking profits on several positions already this week.  My inclination is to continue to reduce risk as market extends this rally.  Currently, futures are pointing to a small gap up open but keep in mind trading will today will not only be affected by hundreds or earnings reports but also the FOMC announcement.

[button_2 color=”green” align=”center” href=”https://youtu.be/uuhY6vGR6Tw”]Morning Market Prep Video[/button_2]

Trade Wisely,

Doug