Nine straight days of record highs in Dow.

Nine straight days of record highs in Dow.

Who doesn’t love a strong Bull?  Yesterday marked the 9th straight all time record highs in the Dow.  The question is how long can this last?  Your guess is as good as mine, but we should prepare for the fact it could end at any time.  Please understand I am not saying a selloff is about to begin or even suggest bearishness.  The overall trend is still up and very strong, and there is nothing in charts right now to suggest that is about to change.  I am only warning about the dangers of complacency.  When the market is extremely bullish, it’s easy to forget that danger could be lurking just around the corner.  Continue to trade long and stay long until something changes but always be prepared with a plan to protect yourself.

On the Calendar

Another very light day on the Economic Calendar today.  The only thing of note is the JOLTS report at 10:00 AM Eastern.  JOLTS tracks job openings which moved lower on the last reading to 5.666 million.  Forecasters for this month expect further declines in job openings for a reading near 5.6 million today.  We have a couple of bond auction today but pretty much wraps up the calendar today.  Even the Fed Speakers have the day off today opposite every other day this week.

On the Earnings Calendar, there are nearly 400 companies reporting today.  DIS is considered a bellwether by many market watchers, so it can be a market moving event when the company reports after the bell today.  Lately, the company has seen declines in subscriptions mostly from its ESPN holdings.  Estimates have placed an earnings target of $1.57 a share target for them today.

Action Plan

Nine days straight up on the DIA with the last six gapping to new highs that have been thus far defended by the Bulls.  How much longer this can continue is anyone’s guess, but we should not be surprised to see a pullback or a consolidation begin at any time.  Yesterday the DIA was finally able to inspire the SPY to participate closing at a new record high.  The QQQ’s also moved higher yesterday but fell short of breaking out and remains under price resistance.  IWM continues to struggle and remains not only under resistance but also under the broken trend.  For the first time in over a week, the Dow Futures currently suggesting a flat to slightly lower open today.

I plan to remain slightly cautious this morning and will likely allow 20 to 30 minutes to pass focusing on price action before making any new trade decisions.  I will be watching to see if the Bulls will continue to support current levels with additional buying or if profit taking will finally begin.  Although I believe the DIA, in the short-term, appears overextended, there is currently nothing in the charts indicating that will change.  That fact, however, doesn’t give me the right to be complacent and ignore the possibility that selling could at any time begin.  As a result, I must have a plan to protect gains as well as my trading capital to avoid emotional decision making in the heat of the moment.

[button_2 color=”green” align=”center” href=”https://youtu.be/lCo35HaCNxs”]Morning Market Prep Video[/button_2]

Trade Wisely,

Doug

$TSCO Bullish Morning Star Pullback

$TSCO Bullish Morning Star Pullback

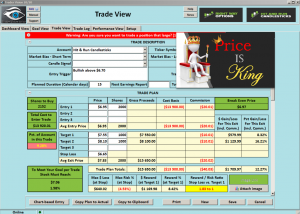
$TSCO Bullish Morning Star Pullback(Tractor Supply) TSCO has printed a Bullish Morning Star Pullback after a strong relief rally. The Rounded Bottom Breakout along with the Bullish price action we are looking for another push in the relief rally.

Good Trading – Hit and Run Candlesticks

Learn more about Hit and Run Candlesticks, and today’s trade idea and plan plus the 10 or more members trade ideas, starting at 9:10 EST AM every morning. Every day we teach and trade using the T-Line, Candlesticks, Support and Resistance, Trends, chart patterns and continuation patterns.

Trade Updates – Hit and Run Candlesticks

We will head into this weeks trading with 16 positions we are managing. $RIG is one we bought last week and holding well in a Rounded Bottom Breakout Pattern, Not the Bullish Flag breakout. $TLRD in another Flag pull back closing Friday with a Bullish Engulf. (Watch the retail earnings this week) $CC is a T-Line Run with a Box ready to pop out.

Are you having trouble putting together a winning trade? Not sure what scans to use? So near to having multiple winning trades, but something always goes wrong. Maybe a couple hours with a trading coach could make all the difference in the world. Hit and Run Candlesticks has 4 trading coachesLearn More about the Coaches

With on-demand recorded webinars, eBooks, and videos, member and non-member eLearning, plus the Live Trading Rooms, there is no end your trading education here at the Hit and Run Candlesticks, Right Way Options, Strategic Swing Trade Service and Trader Vision.


[110.78$%] SEDG was first presented to HRC members on February 14

SEDG moved another 2.72% Friday, The total run now is 110.78% Hit, and Run Candlesticks members have learned the importance of their trading tools, Price with Candlesticks and manage their trades using The T-line, Trend, Trend Lines, Support, and Resistance.


Eyes On The Market (SPY)

The SPY closed above the T-Line last week keeping the Bulls ahead of the Bears. Below $245.70 would put the SPY in in a pullback that could see $240.00. The trend is a powerful friend. Be willing to cut a friend lose when you need to. CAUTION… if the trend changes be ready to change with it.

What is a Trade Idea Watch-list?

A trade idea watchlist is a list of stocks that we feel will move in our desired direction over a swing trader’s time frame.  That time could be one to 15 days for example. From that watch list, we wait until price action meets our conditions for a trade.

Rick’s personal trade ideas for the day MEMBERS ONLY

Start your education with wealth and the rewards of a Swing Traders Life – Click Here


Investing and Trading involve significant financial risk and are not suitable for everyone. No communication from Hit and Run Candlesticks Inc. is financial or trading advice. All information is intended for Educational Purposes Only. Terms of Service.

Rick Saddler is not a licensed financial adviser nor does he offer trade recommendations or advice to anyone except for the trading desk of Hit and Run Candlesticks Inc.


Momentum continues to carry the Dow higher.

Momentum continues to carry the Dow higher.

The rotation into blue chip stocks continues to propel Dow higher.  The sheer momentum of the Bulls continues to plow right through the Bears that tried predicting a top.  Although this momentum seems unstoppable at the moment, it is a reason to raise your caution levels.  If the SPY, QQQ and the IWM were participating in this move, I would be much more comfortable.  However, after nine straight days up in the DIA with all the other indexes not going along creates an unnatural imbalance.  Stay with the trend because as of now there is nothing to indicate it is over.  Focus on the price action because it’s there where we will first see the clues of reversal IF it does come.

On the Calendar

We begin this week with a very light Economic Calendar that slowly ramps up for a few important reports later in the week.  Today there are few insignificant reports along with bond auctions and announcements.  Then we have Fed Speakers at 11:45 AM Eastern and 1:25 PM to round out the day.

The Earnings Calendar starts off at full speed today with nearly 225 companies reporting results.  So, remain alert and keep those seat belts buckled as emotionally charged price action continues.  Do yourself a favor and find out when the companies you hold or are thinking of entering report results.

Action Plan

Friday was a light volume choppy day but a push right at the end of the day closed DIA just $0.03 off the high setting another record close.  Both the SPY and QQQ’s remain locked in consolidation while the IWM remains bearish below price support and trend.  Futures once again are suggesting a gap up open with the DIA leading the way.

It’s amazing how only a few companies in the Dow in have been able to hold up the entire market.  This kind of imbalance makes me very nervous and watchful of a reversal.  However, betting against this kind of wild bullishness is unwise as there is no telling how long it could continue.  With this being the 9th day of the DIA run and the 8th gap up one would naturally think a top is near a begin to bet against it.  Momentum such can last much longer they anyone expects and may actually gain energy, squeezing out short traders that tired predicting a top.  Thus I will continue looking for long trades, but I will also be willing to quickly capture gains or cut off losses if the price action begins to signal trouble.

[button_2 color=”green” align=”center” href=”https://youtu.be/DCAvD728NKk”]Morning Market Prep Video[/button_2]

Trade Wisely,

Doug

Concerned about DIA over-exuberance?

Concerned about DIA over-exuberance?

over-exuberanceAre you concerned about DIA over-exuberance?  I must admit that I am becoming concerned because all the bigger indexes are not participating.  I’m concerned that incredible weight that only a few companies in the Dow are lifting could soon reach a breaking point.  Earnings have been driving this move it is entirely possible that it could continue for a while longer.  A tough lesson that I learned many years ago is that the market can stay irrational much longer than I can stay solvent trying to bet against it!  However, that doesn’t mean that I should be complacent, failing to recognize the market condition or having a plan to protect my profit and trading capital.  The sky is not falling, but a storm could be building on the horizon.  I’m only suggesting it’s better to have your umbrella with you than having no protection at all.

On the Calendar

Friday’s Economic Calendar begins with the very important Employment Situation report at 8:30 AM Eastern.  Employment numbers have been very strong all year, but forecasters expect it will slow this month to 178K down from 222K.  They expect the unemployment rate to be 4.3% and the hourly earnings to remain weak at 0.3%.  Also at 8:30 is the International Trade numbers which the forecasters see narrowing to 44.4 billion deficit versus 46.5 last month

On the Earnings Calendar, we have about 100 companies reporting earnings today.  Next week is another huge week of reports with more than 1200 companies reporting so stay on your toes and expect additional volatility.

Action Plan

Every day this the DIA has managed to not only gap up also set new record high prints doing so.  Futures are suggesting we will end the week doing the same, gapping to a new record.  Unfortuinatlyy the SPY, QQQ, and the IWM have not participated with this amazing DIA run.  Only time will tell how much longer this will last, but I must admit that it makes me very nervous because it is such an abnormal market conditions.

There is no doubt that the trend is still up.  However, I’m worried that the DIA tremendous exuberance has set the stage for a huge increase in volatility very soon.  The VIX has been signaling complacency for some time and five straight days of the DIA are gaping up with out the bigger indexes participation signals the same.  While it is true that earnings reports have been very good, continuing to have the DIA lift that much weight seems unlikely.  Please understand that I at not at all bearish on the market.  I am merely pointing out that if the DIA begins to roll over don’t be surprised to see some very fast profit taking and a big spike in volatility.  I will continue looking for long trades but will be more focused on taking profits ahead of the weekend.

[button_2 color=”green” align=”center” href=”https://youtu.be/rBjUV9tPXkU”]Morning Market Prep Video[/button_2]
Trade Wisely,

Doug

Personal Trade Evaluation

Personal Trade Evaluation

(It’s Friday) Fridays are a good day for personal trade evaluation, pick something about trading you or don’t do and evaluate how you can do it better or may you need to add it to you trading routine. Rather than read someone else’s eBook on the “Ten Things Not To Do In Trading,” write your own eBook based on you and your trading.

Friday is the day we count our money and reflect on our weeks trading. How did we do? How can we improve? Take time today to pause on trading and consider education. Reevaluate your trading goals, are your goals on track?

Learn more about Hit and Run Candlesticks, and today’s trade idea and plan plus the 10 or more members trade ideas, starting at 9:10 EST AM every morning. Every day we teach and trade using the T-Line, Candlesticks, Support and Resistance, Trends, chart patterns and continuation patterns.

Trade  Updates – Hit and Run Candlesticks

Below you will find the Hit and Run Candlesticks trading stats for the past 30 days. Yesterday we sold ½ of the RIG we bought at the planned target. This has been a rough week for trading but managed to get through the door still making money. What a difference a week can make without 2-4 Double-Digit trades and the market a bit soft.


Personal Trade Evaluation

Are you having trouble putting together a winning trade? Not sure what scans to use? So near to having multiple winning trades, but something always goes wrong. Maybe a couple hours with a trading coach could make all the difference in the world. Hit and Run Candlesticks has 4 trading coachesLearn More about the Coaches

With on-demand recorded webinars, eBooks, and videos, member and non-member eLearning, plus the Live Trading Rooms, there is no end your trading education here at the Hit and Run Candlesticks, Right Way Options, Strategic Swing Trade Service and Trader Vision.


Eyes on The Market

Not much change from yesterday DIA’s still lead the way, the SPY is asleep, and the IWM and QQQ’s are having a party in the bad part of town. We own 2 Inverse ETF’s and next week we may start to look at a few short positions if the market gives us a reason.

What is a Trade Idea Watch-list?

A trade idea watchlist is a list of stocks that we feel will move in our desired direction over a swing trader’s time frame.  That time could be one to 15 days for example. From that watch list, we wait until price action meets our conditions for a trade.

Rick’s personal trade ideas for the day MEMBERS ONLY

Start your education with wealth and the rewards of a Swing Traders Life – Click Here


Investing and Trading involve significant financial risk and are not suitable for everyone. No communication from Hit and Run Candlesticks Inc. is financial or trading advice. All information is intended for Educational Purposes Only. Terms of Service.

Rick Saddler is not a licensed financial adviser nor does he offer trade recommendations or advice to anyone except for the trading desk of Hit and Run Candlesticks Inc.


Bull run continues to produce new records.

Bull run continues to produce new records.

Bull run continuesAs this record setting Bull run continues in the DIA, their tenaciousness has proved very impressive.  Setting the sixth new record highs in as many days on the DIA is no small feat.  As impressed as I am with the 30 stocks or the Dow holding up the entire market it also raises a concern.  Unless the other indexes step up and participate soon, I’m concerned the pressure on the DIA could suddenly break.  So come on Bulls get to work in the SPY, QQQ’s and IWM.

On the Calendar

On the Economic Calendar today we start with the weekly Jobless Claims at 8:30 AM Eastern.  Claims have been running steady at historic lows, and forecasters see more of the same expecting claims of 244K this week.  At 10:00 AM we have Factory Orders, and ISM Non-Mfg Index reports.  After back-to-back in May and April consensus expects to see a 2.7% increase in the June numbers on the back of aircraft orders.  Nondurable goods are expected to continue flat with weak pricing.  ISM is expected to remain strong at 56.9 with both new orders and backlogs staying at consistently elevated levels.

The Earnings Calendar is full to the brim with more than 535 companies expected to report today.  With the Employment Situation number coming on Friday morning we would normally see the market quiet and choppy as it waits.  However, with such a huge schedule of earnings reports is reasonable to expect more than normal market volatility.  Make sure you are aware of the reporting dates of stocks that could affect your portfolio.

Action Plan

After the morning gap the Bears went to work trying to take over, but by the end of the day, the Bulls proved to be too strong closing the DIA at a new record high.  Both the SPY and the QQQ’s made significant recoveries from the intraday lows while the small cap index, IWM, continued under selling pressure.

The overall trends clearly remain bullish.  As a result, I will continue to look for long trades in stocks trending in the direction of the overall market.  With so many earnings reports I will be watchful for an extra dose of volatility today.  I will also remain focused on price action.  With the weekend coming and after such a strong DIA rally the possibility of very swift whipsaws or reversals exist.  Please don’t misunderstand.  I am not bearish, suggesting bearishness or even attempting to predict that a selloff is about to begin.  I am merely suggesting it’s wise to consider the possibility and watch price action for clues.  Preparation is always better than making emotional decisions in the heat of the moment!

[button_2 color=”green” align=”center” href=”https://youtu.be/YKcuyxH_llo”]Morning Market Prep Video[/button_2]

Trade Wisely,

Doug