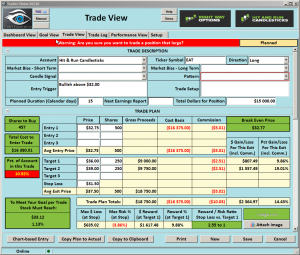
EAT – Bullish Over $32.00
 EAT (Brinker International), Bullish over $32.00 and the Bullish Morning Star on the 3-day chart. The EAT chart has constructed a strong bottom with very good price action coming into a Rounded Bottom Breakout pattern. Understanding what you want out of a trade can help when setting up a trading plan. Price is King!
►EAT – Train Your Eyes, Can You Find the Following?
RBB pattern Doji Engulf pattern •Bullish rectangle• Bullish Morning Star • Doji continuation pattern • Hint, look at the 1 -2- and 3-day charts.
Good Trading – Hit and Run Candlesticks
► Ticker Update (ALGN) Set up a Private Phone Call Us
You could have profited more than 38% or about $675, with 100 shares when we posted to our members on August 8.
If you are interested in learning how to trade charts and end the week with a profit that could change your life simply contact us. Rick Saddler founder of Hit and Run Candlesticks offers private recorded coaching • Coaching Learn More With Rick you can also learn these trading techniques in our membership. – Get Started
► Eyes On The Market
Last week the SPY gave no clues that the Bears were starting to hunt, and for the open today, I still don’t see that. Friday price closed with a Morning Star pattern, and today we need to see confirmation. The open today will be a little soft but remember it’s the complete construction of the candle that we analyze. To stay away from the pain of the noise following fast, medium and medium + is very helpful such as the 3-8-17 or something close to that.
A close below $257.00 on the SPY would warrant a test of the October low.
Rick’s trade ideas for the day – MEMBERS ONLY
30-Day Trial • Monthly • Quarterly • Semi-Annual • Annual
Investing and Trading involves significant financial risk and is not suitable for everyone. No communication from Hit and Run Candlesticks Inc. is financial or trading advice. All information is intended for Educational Purposes Only. Terms of Service.
Rick Saddler is not a licensed financial adviser nor does he offer trade recommendations or advice to anyone except for the trading desk of Hit and Run Candlesticks Inc.
Do you have an edge?
 Will we get the typical pre-FOMC choppy price action or will the 380 earnings reports break the mold? Perhaps the bigger question is, Do you have an edge? On the positive side, the market is trending higher, and so far earnings have been overall strong. On the other side, the market appears overextended, and the uncertainty of earnings reports and FOMC looms.
During times like this, I normally slow my trading activity. I try to focus on my current portfolio first. I tend to slow to add trades during times of uncertainty. I’m only interested in low-risk entries to keep potential losses as small as possible. I try not to chase the morning pops and drops. I choose instead to wait 15 to 30 minutes before looking for new risk. Always remember quality is more important than quantity and prepare for anything.
On the Calendar
On the Economic Calendar, this last day of October begins the FOMC 2-day meeting kicks off. Their announcement regarding interest rates will occur tomorrow at 2:00 PM Eastern. At 8:30 AM today we have the Employment Cost Index is expected to surge 0.7% today. The 9:00 AM reading of the S&P CoreLogic Case-Shiller which is expected to rise 0.6% bringing the year-on-year rate up to 6.0%. Then at 9:45 AM the Chicago PMI is expected to slow just slightly to 62.0 according to forecasters, which is still very strong. The 10:00 AM Consumer Confidence is seen rising to 121.0 vs. September’s 119.8 print.
The Earnings Calendar ramps up today with more than 260 reports. We had better get used to it because the number grows to more than 380 on Wed. and over 600 on Thursday. Prepare, prepare, prepare.
Action Plan
Political turmoil, earnings, and FOMC. Oh, My! With so much on the proverbal market plate, the next few days the uncertainty alone is likely to give traders indigestion. There are a lot of good charts, but because of all the news and the potential violent reactions can you still find an Edge? Tough call.
The good news is that the market is still wildly bullish even considering yesterdays little pullback. If earnings continue to come out positive, then there is every reason to believe that the market will continue its trend. Futures are pointing to a bullish open, however, keep in mind that normally we get choppy price action as the market waits on the FOMC. The problem is, I’m not sure normal applies here! Anything is possible so plan accordingly.
Trade Wisely,
Doug
[button_2 color=”green” align=”center” href=”https://youtu.be/oXQXU5NDo6A”]Morning Market Prep Video[/button_2]
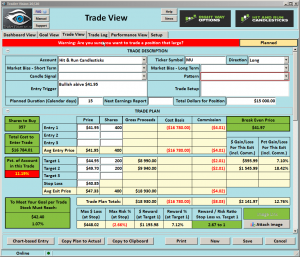
MU – Bullish Over $41.95
 MU (Micron Technology), Bullish over $41.95 The MU Chart saw a little profit taking in September then the Bulls came back in with a Bull Kicker. A small run accrued followed by bullish consolidation. The past 3 bars have formed a bullish Morning Star closing back over the T-Line.
Don’t miss out on our 30-Day Trial Click Here
►Train Your Eyes, Can You Find the Following?
34-Rising Trend • Bull Kicker •Bullish rectangle• Bullish Morning Star • 24 day V-Stop Run.
Good Trading – Hit and Run Candlesticks
► Ticker Update (SEDG)
You could have profited more than 142% or about $1919, with 100 shares when we posted to our members on February 14. If you are interested in how to trade charts like this, Rick Saddler founder of Hit and Run Candlesticks offers private recorded coaching • Coaching With Rick you can also learn this trading technique in our membership. – Get Started
[button_2 color=”orange” align=”center” href=”https://hitandruncandlesticks.com/hrc-rwo-30-day-offer/” new_window=”Y”]30-Day Trial HRC – RWO or Both[/button_2]
► Eyes On The Market
The SPY closed yesterday with a Doji inside day that suggests indecision. The T-line trend remains bullish as well as the J-Hook continuation chart pattern. On the 2-day chart, the price has closed above the V-Stops and the upper T-Line Band for the past 22 days. I am hearing about a few traders starting to short, be very careful shorting when the market is such a Bull.
Rick’s trade ideas for the day – MEMBERS ONLY
30-Day Trial • Monthly • Quarterly • Semi-Annual • Annual
Investing and Trading involves significant financial risk and is not suitable for everyone. No communication from Hit and Run Candlesticks Inc. is financial or trading advice. All information is intended for Educational Purposes Only. Terms of Service.
Rick Saddler is not a licensed financial adviser nor does he offer trade recommendations or advice to anyone except for the trading desk of Hit and Run Candlesticks Inc.
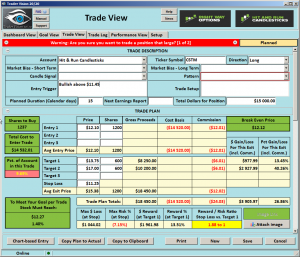
CSTM – Bullish Above 11.45
 CSTN (Constellium NV), The CSTM Chart has consolidated for the past couple of months and is now Bullish above $11.45. Last week CSTM broke out and closed above a double top after finding support from the 34-EMA and 50-SMA. On a 2-Day chart of CSTM, you can see the Ascending Triangle and the Bullish Engulf.
If you need coaching on setting up your trade plan Click Here
►Train Your Eyes
CSTM • Trend • Ascending Triangle •Rising 34-EMA • Bullish Engulf • (Hit: Look at a 2-day chart)
Good Trading – Hit and Run Candlesticks
► Ticker Update (ALGN)
You could have profited more than 35% or about $6100.00, with 100 shares when we posted to our members on August 8. If you are interested contact • Coaching With Rick
► Eyes On The Market
Friday ended on a Bullish note with the SPY printing a Bullish J-Hook Continuation pattern. (The 2-Day chart printed a Bullish Morning Star). Price vs-Line and T-Line Bands are bullish, price vs. price is bullish, price vs. V-Stop is bullish. I would say the market is bullish. Below $255.60 or about the T-Line would bring the VIX up a little. The VIX closed below the Lower T-Line Band and below the VStop but support and bottom construction are still evident.
Rick’s trade ideas for the day – MEMBERS ONLY
30-Day Trial • Monthly • Quarterly • Semi-Annual • Annual
Investing and Trading involves significant financial risk and is not suitable for everyone. No communication from Hit and Run Candlesticks Inc. is financial or trading advice. All information is intended for Educational Purposes Only. Terms of Service.
Rick Saddler is not a licensed financial adviser nor does he offer trade recommendations or advice to anyone except for the trading desk of Hit and Run Candlesticks Inc.
Remain Objective
 With such a strong bull run underway it can be difficult to remain objective. There are those with a wildly bullish market bias and those expecting an imminent collapse as a result of the being overbought. The financial news only serves to fan the flames of both sides of this drama. Toss in turbulent government and about 1500 earnings reports and you have the makings for a very wild week. So whats a trader to do?
What works for me is to turn off all the noise, focus on price action, my trading rules, goals and discipline. Price is King. I can only make money if I’m on the right side a price move. What I think or feel should happen is completely irrelevant and only clouds my view of actual price action. Turn off the noise, set your bias aside and trade the chart.
On the Calendar
The Economic Calendar begins with a potential market-moving report at 8:30 AM Eastern. The Personal Income and Outlays core number is expected to rise by only 0.1% September with the year over year rate stuck at 1.3%. However, personal income is expecting an increase of 0.4%, and consumer spending is expected to jump 0.9% as a result of post-hurricane auto replacements. At 10:30 AM is the Dalla Fed Mfg. Survey is not expected to move the market with a strong number of 21.3 according to forecasters.
The Earnings Calendar will be front and center this week with more than 1500 companies reporting. Today we get it kicked off with just over 180 posting results. I highly recommend taking the time to make sure of the reporting dates of companies you hold or those you are considering as new purchases.
Action Plan
Last week ended with a bang due to some great big tech earnings reports. Both the SPY and the QQQ closed at new record highs while DIA and IWM lagged slightly behind. Currently, futures are pointing to lower open as I write this but with so many earnings reports coming out that could easily change. There is widespread speculation today of possible arrests from the Russian investigations. That, of course, could temper the bulls enthusiasm as it could slow or even stop the tax plan.
As for me, I will stay the course, trading with the trend which is bullish but extended. With such a huge number of companies reporting this week anything is possible. Don’t be surprised to volatile moves up or down as the market reacts to earnings as well as the news. Fast intraday whips are not out of the question so avoid chasing and wait for low-risk defensible positions. My suggestion is to turn off the news, avoid the drama and stay focused on the price the action.
Trade wisely,
Doug
[button_2 color=”green” align=”center” href=”https://youtu.be/ZYDSFcTFYX0″]Morning Market Prep Video[/button_2]
Greed
 The Bulls continue to dominate, and thus far earnings reports are supporting their efforts. There is a saying here in farming country, “There is nothing like rising prices to break farmers.” When corn prices are running higher farmers will buy and develop more cropland. Heavily invest in more equipment to get the job done and plant every square inch of ground they can find with corn. As a result, corn supplies soar, and prices per bushel begin to fall like a rock. That’s the effect of greed.
As traders, it’s very important to guard against greed. When the market is bullish trade it long, but take caution not to over-trade. A Bull market is fantastic, but complacency will destroy an account. Hold fast to your rules and maintain your discipline. It’s also very important to take profits along the way. Give us a dollar, and we want two. That’s human nature. Any business requires consistent profits to prosper, and trading is a business like any other. Never allow greed to prevent you from taking a profit. One day tide will go out, and profits will quickly evaporate.
On the Calendar
There is not much on Friday’s Economic Calendar, but it kicks off at 8:30 AM Eastern with the very important GDP. The 3rd quarter GDP is expected to slow to a 2.5% annualized rate from 3.1% last quarter. The decline is a reflection of the major hurricane impacts on the economy. Consumer Spending is also expected to decline to 2.3% vs. 3.3% last quarter. Forecasters believe business investment may have softened slightly while vehicle sales moved higher. The GDP price index could rise as to 1.6% overall vs. the 1.0 reading in the second-quarter. At 10:00 AM Consumer Sentiment is expected to remain very strong at 101.0 on this reading.
The Earnings Calendar is showing about 130 companies reporting today. Make sure you are checking reporting dates as part of your daily trading preparation.
Action Plan
Big tech knocked the cover off the ball with the after the bell reports. Futures are once again pointing to a gap up open as GOOG and MSFT gap to new record highs. Everything seems to be coming up roses for the market but do not forget the weekend ahead and the possibility of profit taking into strength. Next week is even bigger than this on the earnings calendar so keep in mind anything is possible. Keep that in mind as you plan for the weekend and the week ahead.
Trade Wisely,
Doug
[button_2 color=”green” align=”center” href=”https://youtu.be/g5NAH3hL7wQ”]Morning Market Prep Video[/button_2]
 EAT (Brinker International), Bullish over $32.00 and the Bullish Morning Star on the 3-day chart. The EAT chart has constructed a strong bottom with very good price action coming into a Rounded Bottom Breakout pattern. Understanding what you want out of a trade can help when setting up a trading plan. Price is King!


