Four Day Work Week
 (It’s Friday) Back when I worked at a job I always wished we only had a four day work week. Well, when I started trading for a living I cut the tie and almost have a four day work week. The last thing I do is glue myself to the computer screen all day because I think I have to be. You’re the boss now, take some time off, enjoy your Friday. Besides it’s a good day to count your money and think back how you did this past week and work on any adjustment or maybe it’s a good day to catch up on the trading education.
Good Trading – Hit and Run Candlesticks
Learn more about Hit and Run Candlesticks, and today’s trade idea and plan plus the 10 or more members trade ideas, starting at 9:10 EST AM every morning. Every day we teach and trade using the T-Line, Candlesticks, Support and Resistance, Trends, chart patterns and continuation patterns.
Give us a try If you would like to learn what and how we do it click here to give us a try, cancel at any time.
►Eyes on The Market
The Bearish Engulf still lurks as of the close yesterday; price closed as an inside day below the T-Line. Price also closed above the Lower T-Line Band showing the Bulls are not ready to give up the fight. The futures are up this morning, mostly because of AMZN… Ya AMZN!
Rick’s trade ideas for the day MEMBERS ONLY
Start your education with wealth and the rewards of a Swing Traders Life – Click Here
Investing and Trading involves significant financial risk and is not suitable for everyone. No communication from Hit and Run Candlesticks Inc. is financial or trading advice. All information is intended for Educational Purposes Only. Terms of Service.
Rick Saddler is not a licensed financial adviser nor does he offer trade recommendations or advice to anyone except for the trading desk of Hit and Run Candlesticks Inc.
LLNW – Waiting For The Signal
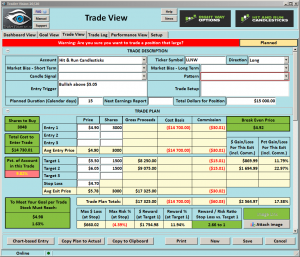
 LLNW (Limelight Network), The LLNW Chart has trended nicely on the back of the T-Line and has now felt a little profit taking. A few buyers stepped in with a little Doji yesterday above the T-Line, both T-Line Bands and the VSTOP Dots. LLNW has pulled back to the T-Line for a “PBO setup.” Now just waiting for an entry signal. If you need coaching on setting up your trade plan Click Here
►Train Your Eyes
LLNW • Trend • Bullish Harami •T-Line Run• J-Hook Breakout • PBO • Flag
Good Trading – Hit and Run Candlesticks
► Ticker Update (PYPL)
You could have profited more than 19% or about $1133.00, with 100 shares when we posted to our members on August 16. If you are interested in trades and profits, Rick Saddler founder of Hit and Run Candlesticks offers private recorded coaching • Coaching With Rick
► Eyes On The Market
Yesterday the SPY closed in a bearish Doji continuation pattern as I described in yesterday’s blog report. Price also closed below the upper T-Line band and the T-Line. The 3-Day chart has printed a Bearish Engulf and on the daily chart, price is below the VStop Dot. Looking at the VIX price has started to tren, the T-Line is above the 34-EMA and price challenged the 200-SMA yesterday. I’m not trying to paint a bleak bearish picture but trying to create caution.
Rick’s trade ideas for the day – MEMBERS ONLY
30-Day Trial • Monthly • Quarterly • Semi-Annual • Annual
Investing and Trading involves significant financial risk and is not suitable for everyone. No communication from Hit and Run Candlesticks Inc. is financial or trading advice. All information is intended for Educational Purposes Only. Terms of Service.
Rick Saddler is not a licensed financial adviser nor does he offer trade recommendations or advice to anyone except for the trading desk of Hit and Run Candlesticks Inc.
Maintain an Edge.
 My knowledge of technical analysis and reading price action is what gives me an edge in the market. To make a living as a full-time trader, I have to recognize when I have an edge and when I don’t if I want to make consistent profits. We all know that individual earnings are unpredictable. When we get them in groups of 500, they can easily swing the entire market before the open or after it closes. That means to trade today I have to be willing to give up my edge, toss caution to the wind and embrace gambling. I choose to maintain an edge!
I’m very light in my accounts and don’t expect to add new risk today. With so many unpredictable earnings reports I have to forfeit my technical analysis edge to trade today. Gambling has never been a winning strategy for me. When my edge is gone, I prefer to stand on the sideline watching the battle and protecting my capital. Buckle up friends; it could be a bumpy ride!
On the Calendar
One hour before the market opens the Economic Calendar get the day going with International Trade and the weekly Jobless Claims reports. International trade is expected to widen the deficit in September with a consensus reading of $63.9 vs. $63.3 billion. Also at 8:30 AM Eastern the weekly Jobless claims were expecting 235K only slightly higher than the 222K last week. At 10:00 AM Pending Home Sales number is expected to rise 0.4% after last months 2.6% drop due to hurricane impacts. There is a Fed Speaker at 10:30 AM as well as a few lessor reports and bond auctions.
Today is a huge day on the Earnings Calendar with more than 500 companies expected to fess up to last quarters results. There are a lot of potential market-moving reports today with the likes of GOOG, MSFT, INTC, WDC, WYNN, AAL, BMY, COP, MO just to name a few.
Action Plan
Yesterdays light sell-off is being met this morning with futures are currently pointing to a slight bounce back at the open. With so many companies reporting the bulls and bears will have a lot to fight about in the next 2 hours before the market opens. Anything is possible. Then after the market close will some really big hitters report, so no matter what happens during the day, it could all change in the after-hours session.
Trade Wisley,
Doug
[button_2 color=”green” align=”center” href=”https://youtu.be/qCyjzwZfd3k”]Morning Market Prep Video[/button_2]
A case for caution.
 Earnings season creates lots of drama, intrigue, and hype as well as the dream of striking it rich by picking the big winner. It’s easy for even experienced traders to get caught up in the gold rush that earnings season creates. It’s the same business plan that built Las Vegas. Trading an earnings event is gambling pure and simple. Anything is possible, and I think a good reason to build a case for caution.
Successful trading is not a sprint; it’s a marathon that requires careful planning and endurance. We all want more but the allure of the big win is often the temptress leading us to slaughter. With more than 800 companies reporting the next two days anything is possible and could make for violent market action. I have learned over the years (often the hard way) I don’t have to trade every day to be successful. As technical traders, we give up our edge by over trading earnings. Think about it. If anything is possible, isn’t that gambling? How can technical analysis give us much of an edge if anything is possible?
On the Calendar
The hump day Economic Calendar has three potential market-moving reports. At 8:30 AM Eastern is the Durable Goods Orders which consensus expects a gain1.0% overall. Ex-transportation is seen as up 0.5% and core capital goods also increasing 0.5%. At 10:00 AM we get the New Home Sales report which is expected to moderate to a 555k annualized rate in September vs. the 560K in August. Then at 10:30 AM is the EIA Petroleum Status Report. There are no forecasts for petroleum, but a quick look at oil stocks would suggest traders are bullish and expecting demand to continue to lower national supplies.
The earnings calendar has more than 300 companies reporting today. If you need an example as to why you need to be aware of earnings reports take a look at CMG, JNPR, and AMD this morning. These companies reported after the close yesterday. Those traders will be singing the blues with big losses in their accounts today!
Action Plan
Although the DIA set new records yesterday on the back of great earnings reports from MMM and CAT, the other indexes took a little siesta from the rally. Futures are pointing to a flat open currently but with so many companies reporting earnings today that could obviously change in very quickly.
The overall trends are bullish, but for most traders, I think it’s time to exercise a little caution. With so much data coming out the next couple days could be very challenging. Big gaps and whipsaw price action can damage the accounts of even the most experienced traders. Try not to get caught up in the drama and hype surrounding earnings. Remember we want Quality over Quantity and not every day has to be traded to be successful.
Trade Wisely,
Doug
[button_2 color=”green” align=”center” href=”https://youtu.be/TMpZLUIU-jo”]Morning Market Prep Video[/button_2]
NTNX – May Challenge $33.90
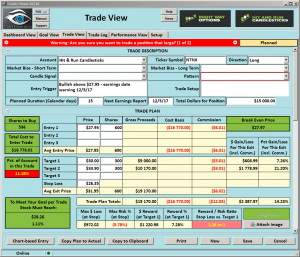
 NTNX (Nutanix Inc), The NTNX Chart looks like it wants to challenge the $33.90 area. Price has recently broken out of $24.90 and is currently painting a J-Hook continuation pattern. The J-Hook pattern is also the Handle to the Cup. Beware of earnings, please con
firm date 12/5/17
►Train Your Eyes
NTNX • Cup and Handle • Morning Star • J-Hook • Flag • Trend
Good Trading – Hit and Run Candlesticks
[button_2 color=”teal” align=”center” href=”https://ob124.infusionsoft.com/app/orderForms/HRC-Hit–Run-Candlesticks-30-day-Trial-1497″ new_window=”Y”]$14.00 30-Day Membership Trial[/button_2]
► Ticker Update (SHW)
You could have profited more than 12.9% or about $4435.00, with 100 shares when we posted to our members on September 11. If you are interested in trades and profits, Rick Saddler founder of Hit and Run Candlesticks offers private recorded coaching • LEARN MORE
► Eyes On The Market
Even tho the SPY chart has printed a Bearish Engulf, and a Doji at the lower half of the candle price has still closed above the T-Line. Bullish or bearish signals require confirmation and with price closing above the T-Line is suggesting the buyers are stronger than the sellers. (At least for yesterday). As of the close yesterday, the trend is still bullish with a pullback or consolidation threatening the chart.
Rick’s trade ideas for the day – MEMBERS ONLY
30-Day Trial • Monthly • Quarterly • Semi-Annual • Annual
Investing and Trading involves significant financial risk and is not suitable for everyone. No communication from Hit and Run Candlesticks Inc. is financial or trading advice. All information is intended for Educational Purposes Only. Terms of Service.
Rick Saddler is not a licensed financial adviser nor does he offer trade recommendations or advice to anyone except for the trading desk of Hit and Run Candlesticks Inc.
AMBA – Bull Kicker and Bullish J-Hook Continuation Pattern
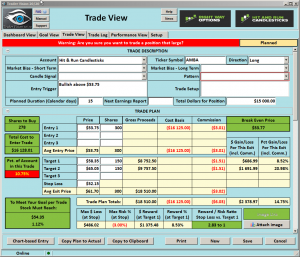
 AMBA (Ambarella Inc), The AMBA Chart, has printed a Bull Kicker and Bullish J-Hook continuation pattern in a long-term wedge pattern. A breakout and follow through is a must. If the Bulls can pull off a breakout AMBA has potential 50% + run in it.
►Train Your Eyes Contest
AMBA • Starting 9/5/17 find the Bullish Engulfs • The Bull Kicker • and the Bullish Morning Stars.
Email your answers to Rick Saddler; two winners will be drawn for a free month with HRC or RWO your choice.
Good Trading – Hit and Run Candlesticks
► Ticker Update (AZO)
You could have profited more than 11.25% or about $6000.00, with 100 shares when we posted to our members on August 31.
If you are interested in trades and profits, Rick Saddler founder of Hit and Run Candlesticks offers private recorded coaching • LEARN MORE
► Eyes On The Market
In yesterday’s market update I wrote, “With Friday’s close, we see support around the $256.00 area”. The SPY found intraday support at $256.02. The Bearish Engulf requires follow through to be damaging to the buyers. A close above $256.95 gives the short term sellers hope and encourages them.
Overall the trend is bullish, as of now we are looking pullback to be buying opportunities as long as the trend remains intact.
Rick’s trade ideas for the day – MEMBERS ONLY
Monthly • Quarterly • Semi-Annual • Annual
Investing and Trading involves significant financial risk and is not suitable for everyone. No communication from Hit and Run Candlesticks Inc. is financial or trading advice. All information is intended for Educational Purposes Only. Terms of Service.
Rick Saddler is not a licensed financial adviser nor does he offer trade recommendations or advice to anyone except for the trading desk of Hit and Run Candlesticks Inc.
 (It’s Friday) Back when I worked at a job I always wished we only had a four day work week. Well, when I started trading for a living I cut the tie and almost have a four day work week. The last thing I do is glue myself to the computer screen all day because I think I have to be. You’re the boss now, take some time off, enjoy your Friday. Besides it’s a good day to count your money and think back how you did this past week and work on any adjustment or maybe it’s a good day to catch up on the trading education.


