Impressive show of force.
 The NASDAQ joined the Russell to compete for market leadership as the bulls make an impressive show of force yesterday with both indexes printing new record highs. The SPY broke-out of consolidation while the DIA continues to lag behind although much strongly looking that just a few days ago when it was threatening failure of its 50-day average.
With trade uncertainty continuing to bubble to the surface traders should remain focused on price action. As we have all experienced recently, reversals can occur with the speed of a single tweet or ill-timed political comment from either side of the negotiations. Make sure to have a plan to protect profits and don’t allow greed to get in the way of taking them regularly.
On the Calendar
On the Economic Calendar for Tuesday is the Redbook at 8:55 AM and PMI Services at 9:45 AM Eastern. There are to potential market-moving reports that both come out at 10:00 AM. First, the ISM Non-Mfg Index where forecasters expect an increase of 1.2 points to 58.0. Secondly, the JOLTS reports expects to remain very strong with a reading of 6,543 million open positions looking for qualified employees to fill them across the country. At 11:30 AM we have a single bond auction to close the calendar day.
On the Earnings Calendar, we have 34 companies reporting earnings today. It is important to make a habit of checking earnings dates for the companies you hold and those you are considering to purchase.
Action Plan
A beautifully bullish day in the market yesterday with the QQQ showing the strongest performance with a new record high close joining IWM with its record close. The SPY broke above the price resistance of the recent consolidation and showing the energy to hold there through the close of the day. The DIA also gaped up strongly but as of right now continues to lag behind and is back into the consolidation zone that started in early May.
As I write this, the futures are pointing to a modestly bullish open today. New all-time highs in several tech companies yesterday including AAPL, AMZN, NVDA, and MSFT to name a few. It would be really nice to see a follow-through bullishness today but keep a close eye on price action because profit takers could begin to step in at any time. Keep in mind that political uncertainty continues to swirl in trade negotiations so have a plan in place to protect profits if trade jitters suddenly return.
Trade Wisely,
Doug
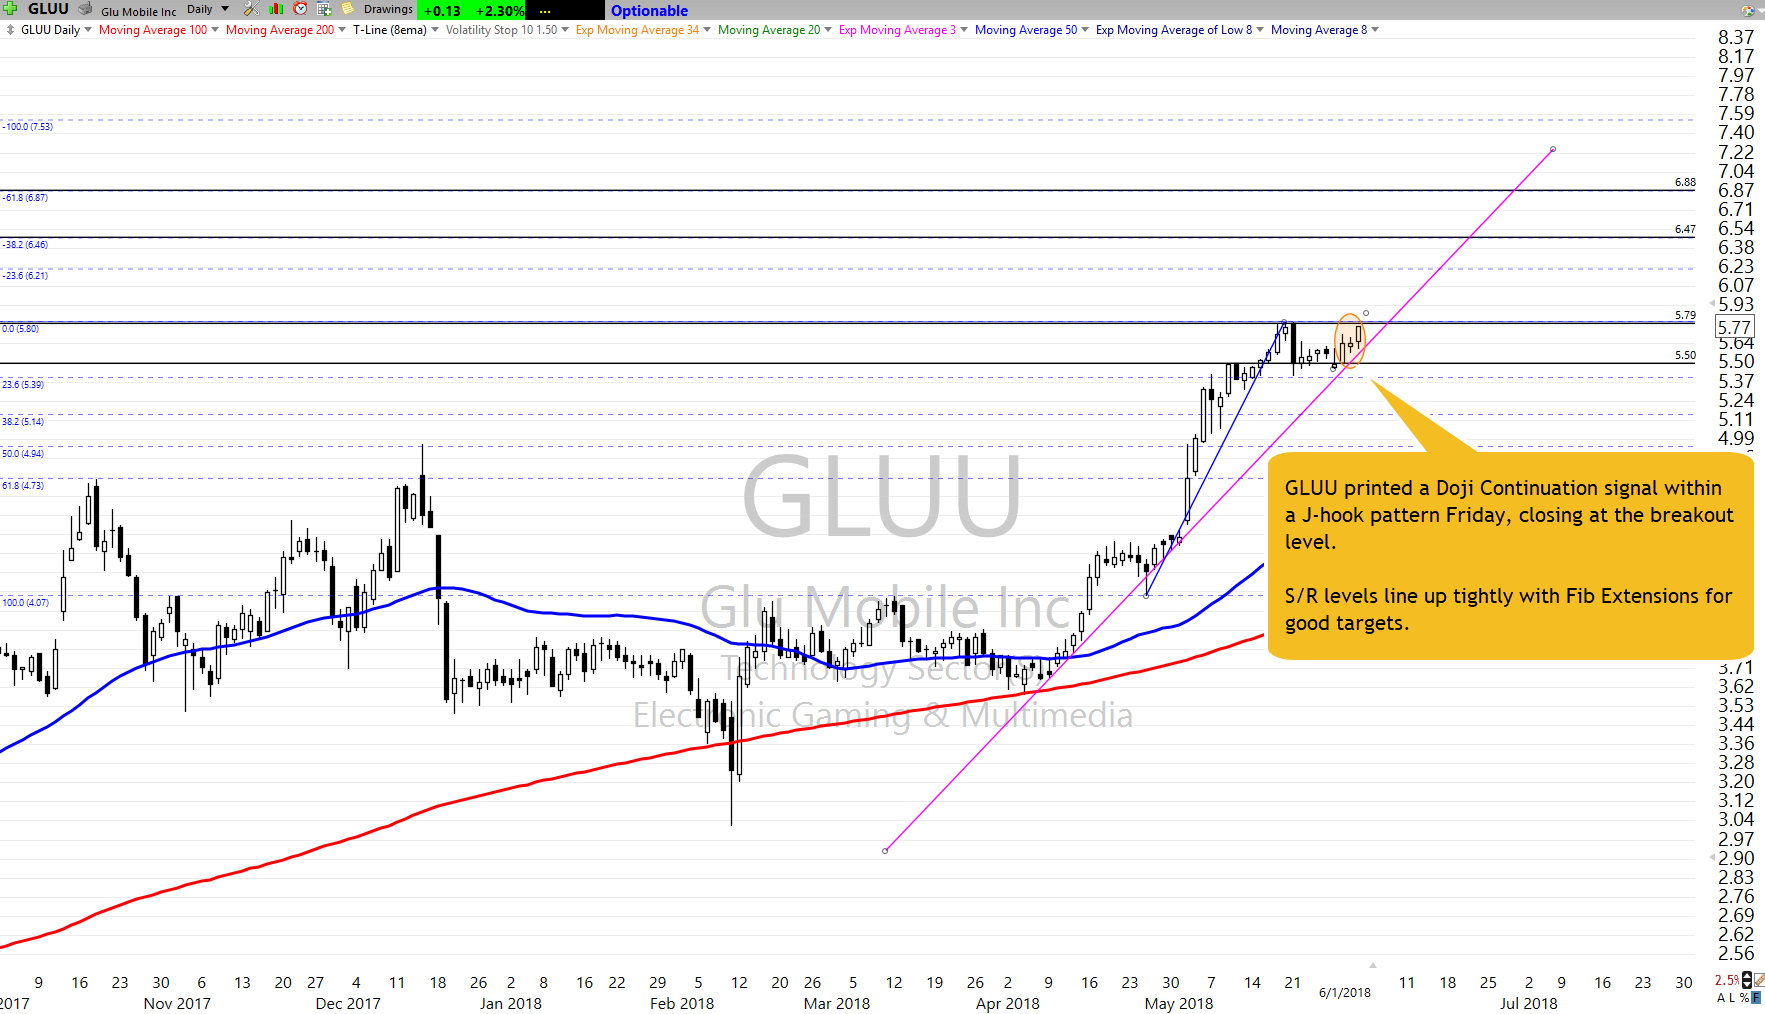
Today’s Featured Trade Idea is GLUU. There is a lot to like about this stock which has been solidly Bullish, even in the face of an overall Market that has chopped back-and-forth in a range for weeks. However recently it has done a brief J-hook pattern to consolidate and avoid over-extension. Now it has printed a Doji Continuation at the breakout level. As a bonus, we now have video of the markup and creation of the trade plan (which took less than 4 minutes, including talking to record the video).
For a more detailed analysis of the ticker, refer to Rick’s Public Stock Trade Idea for today…or, of course, members can listen to his detailed analysis in the trading room at 9:10am Eastern.
However, for now, here is my analysis and a potential trade plan made using our Trader Vision 20/20 software.
The DDD Trade Setup – As of 6-4-18
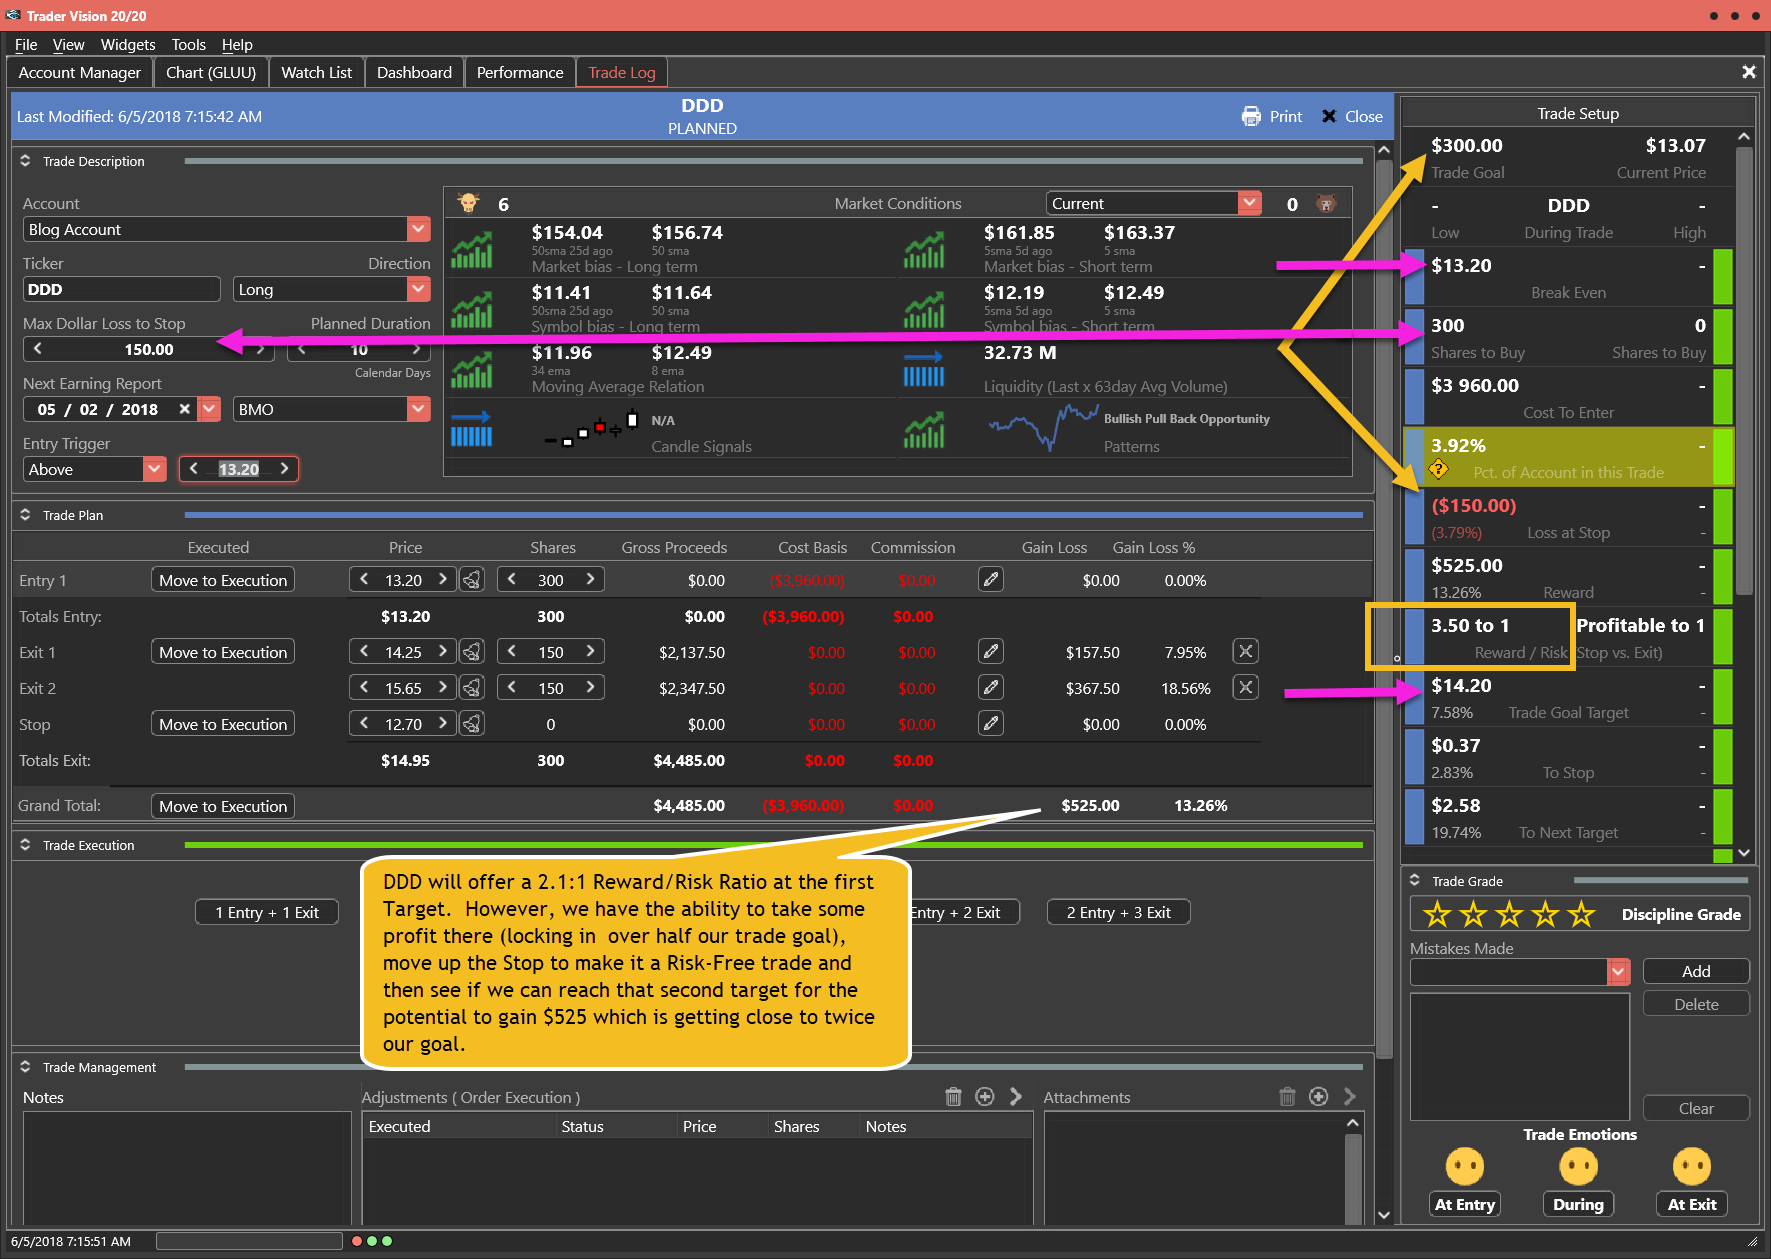
The DDD Trade Plan

Note how Trader Vision 20/20 does so much of the work for you. As the magenta arrows above show, with Trader Vision, not only do we know the break-even price, but we also know exactly how far a trade must move to reach our Goal for the trade. In addition, TV20/20 tells us how many shares we can buy and still keep our potential loss (if Stopped out) below our chosen risk level for the trade.
To see a short video of this trade’s chart markup and trade planning, click the button below.
[button_2 color=”light-green” align=”center” href=”https://youtu.be/X5PUt0UpXME” new_window=”Y”]Trade Plan Video[/button_2]
Upcoming Workshop:
Time is running out…act now to save your seat
Trading With Fibonacci Retracements/Extensions
6/7/18 at 8pm Eastern
- Why do Fib Ratios Work?
- Why Should You Use Extensions instead of Projections?
- Answers to Common Problems Using Fibs.
- Where do you begin and end your drawing?
- Do we use Bodies or Wicks?
- Which Ratios should be your focus?
- How to Identify the major support/resistance Levels with Fibs?
- How to Find Entries with Fib Retracements?
- How to Set Targets Using Fib Extensions?
[button_2 color=”red” align=”center” href=”https://ob124-cea4cb.pages.infusionsoft.net/” new_window=”Y”]Fibonacci Retracement An Extensions Workshop • Click To Learn More[/button_2]
Testimonial
This is not your usual service that sends out a ton of stock recommendations, and then cherry picks the winners to show you how great they are. Hit and Run Candlesticks and Right Way Options are truly educational services. They taught me how to trade not what to trade. The entire team: Rick, Doug, Steve, and Ed are there to help and answer your questions. They are awesome. They cut years off my learning curve. And it’s a team effort. Everyone in the room (all the members) are there to help with invaluable insights and advice. The only service you will ever need. Thanks to all the team for how you have helped me and for all you do. –Jonathan Bolnick
***************************************************************************************************
Investing and Trading involve significant financial risk and is not suitable for everyone. No communication from Hit and Run Candlesticks Inc. is to be considered financial or trading advice. All information is intended for Educational Purposes Only. Terms of Service.
Ed Carter is not a licensed financial adviser nor does he offer trade recommendations or advice to anyone.
***************************************************************************************************
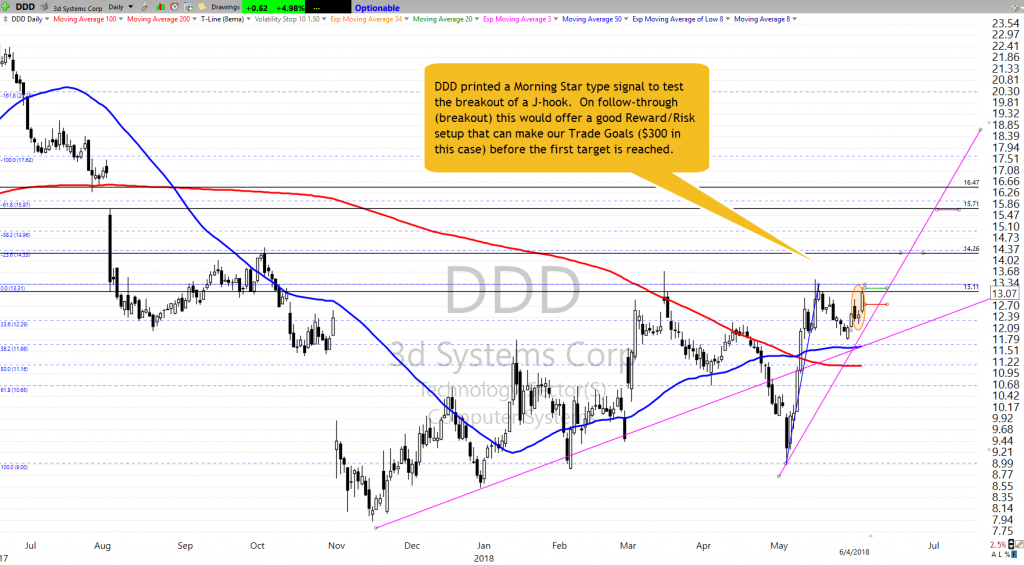
Let’s Shoot For 18% On DDD
With the current patterns on DDD let’s shoot for 18%. The current trend has had several opportunities too own DDD, and there is one now. I see an Inverted Head and Shoulder pattern, J-Hook Continuation pattern, and a Morning Star signal. Don’t forget to look at the two days, three day and 5-day charts. Remember to check out the TV2020 blog for the trade plan. FACT: You cannot trade successfully without trading education.
[button_1 text=”Fibonacci%20Workshop%20That%20Will%20Help%20With%20Trading%20Succsess” text_size=”32″ text_color=”#000000″ text_bold=”Y” text_letter_spacing=”0″ subtext_panel=”Y” subtext=”Click%20To%20Learn%20More” subtext_size=”18″ subtext_color=”#ffffff” subtext_bold=”Y” subtext_italic=”Y” subtext_letter_spacing=”0″ text_shadow_panel=”N” styling_width=”40″ styling_height=”30″ styling_border_color=”#000000″ styling_border_size=”1″ styling_border_radius=”6″ styling_border_opacity=”100″ styling_gradient_start_color=”#4476ee” styling_gradient_end_color=”#4476ee” drop_shadow_panel=”N” inset_shadow_panel=”N” align=”center” href=”https://ob124-cea4cb.pages.infusionsoft.net/” new_window=”Y”/]
SPY • More Buyers Than Sellers
Another fine day in the market yesterday, you gotta love this job. The price action in the SPY was a sign of the buyers flexing there muscle. A close over $273.60 today would indicate the buyers still plan to challenge the upper channel line. From the daily chart to the weekly chart you can see Bullish Engulfs, a Bullish Rising Method, and Bullish Morning Stars not to mention the continuation pattern. VXX – The Red, White and Blue indicator is signaling there is not much fear in the VXX chart. Price is also below the T-Line
Rick’s Trade-Ideas Reserved for Members
Focus Trading Education
Candlesticks • Price Action • T-Line • T-Line Bands • Support • Resistance • Trend • Trendlines • Chart Patterns • Buy Box • Volatility Stops • Profit Zones • Entry Zones • Protective Stops • RBB Rounded Bottom Breakout Strategy • Pop Out of The Box Strategy • Pinball Strategy • Trade Planning, Fibonacci, Stoch/RSI
To learn more about our trading tools join us in the trading room or consider Private Coaching.
Testimonial
This is not your usual service that sends out a ton of stock recommendations, and then cherry picks the winners to show you how great they are. Hit and Run Candlesticks and Right Way Options are truly educational services. They taught me how to trade not what to trade. The entire team: Rick, Doug, Steve, and Ed are there to help and answer your questions. They are awesome. They cut years off my learning curve. And it’s a team effort. Everyone in the room (all the members) are there to help with invaluable insights and advice. The only service you will ever need. Thanks to all the team for how you have helped me and for all you do. –Jonathan Bolnick
Rare to have a service teach you how they find their choices but, HRC/RWO teach you how to fish instead of fishing for you. And, your ideas are not panned but shared, implemented, or improved. Sharing is caring. –Thomas Bradly
Investing and Trading involve significant financial risk and is not suitable for everyone. No communication from Hit and Run Candlesticks Inc. or Rick Saddler is to be considered financial or trading advice. All information is intended for Educational Purposes Only. Terms of Service.
Rick Saddler is not a licensed financial adviser nor does he offer trade recommendations or advice to anyone.
*************************************************************************************
Today’s Featured Trade Idea is GLUU. There is a lot to like about this stock which has been solidly Bullish, even in the face of an overall Market that has chopped back-and-forth in a range for weeks. However recently it has done a brief J-hook pattern to consolidate and avoid over-extension. Now it has printed a Doji Continuation at the breakout level. As a bonus, we now have video of the markup and creation of the trade plan (which took less than 4 minutes, including talking to record the video).
For a more detailed analysis of the ticker, refer to Rick’s Public Stock Trade Idea for today…or, of course, members can listen to his detailed analysis in the trading room at 9:10am Eastern.
However, for now, here is my analysis and a potential trade plan made using our Trader Vision 20/20 software.
The GLUU Trade Setup – As of 6-1-18
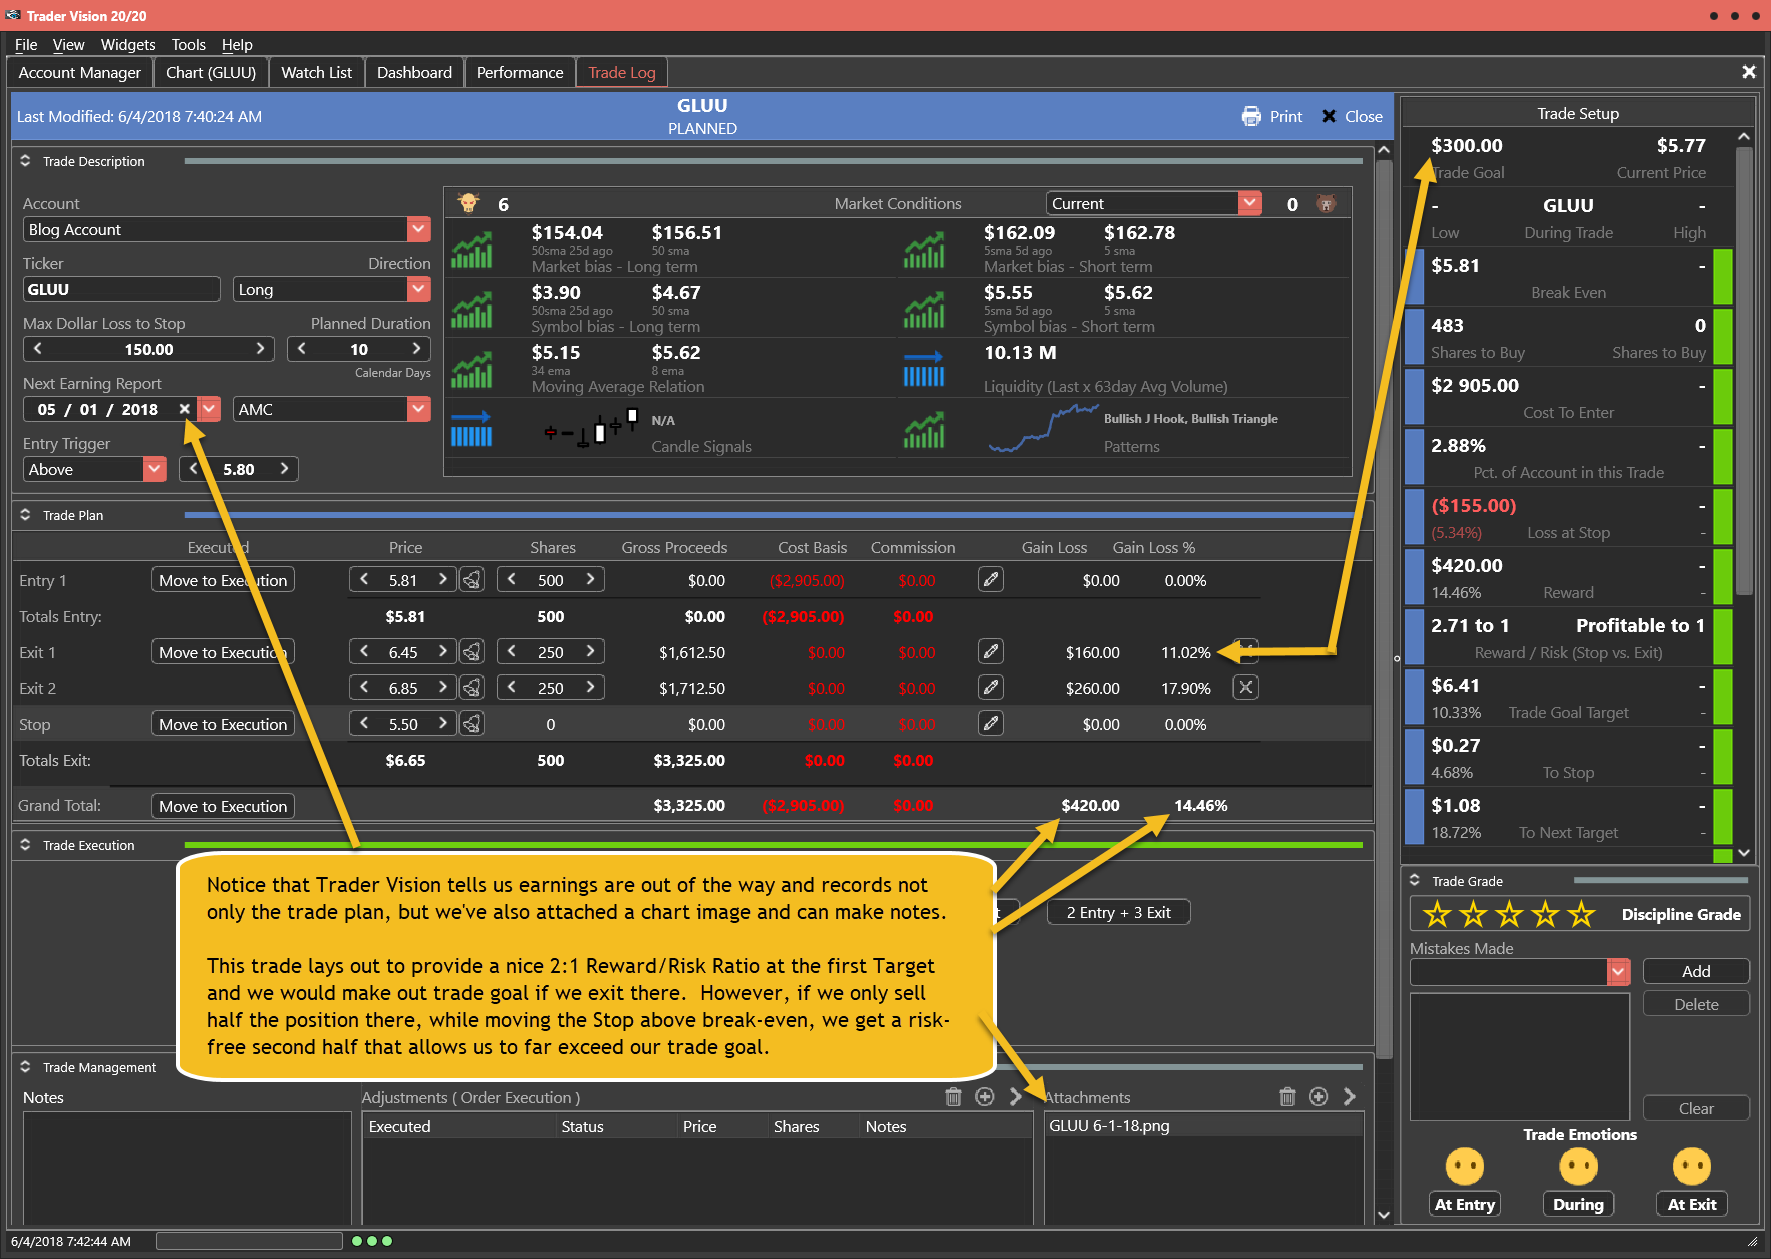
The GLUU Trade Plan

In this trade, note how Trader Vision 20/20 does the work for you by looking up the earnings date and analyzing the chart versus good trading rules. In this case, it tells us we have the Short-Term and Long-Term trends in favor of a Long trade as well as multiple Bullish Patterns in place. We noted in the video that the Add to this the fact that the Candles Signal is close to (but not exactly) a Bullish Signal and the relation to Support and potential Resistance and it all comes down to a nice Setup.
Also, note that the trade can reach the Trade Goal by selling only half the position at the first Target. If that comes to pass, you’d have the chance to keep raising your Stop while letting the Longer-Term Trend work for the second half of your position. That could lead to a risk-free second half and an Reward/Risk over 2.71:1. This means risking $155 for a chance to make between $320 (if 100% is sold at Target #1) or even $420 (If half is eventually sold at Target #2).
[button_2 color=”light-green” align=”center” href=”https://youtu.be/0wYvW4YQAUg” new_window=”Y”]Trade Plan Video[/button_2]
Upcoming Workshop:
Trading With Fibonacci Retracements/Extensions
6/7/18 at 8pm Eastern
- Why do Fib Ratios Work?
- Why Should You Use Extensions instead of Projections?
- Answers to Common Problems Using Fibs.
- Where do you begin and end your drawing?
- Do we use Bodies or Wicks?
- Which Ratios should be your focus?
- How to Identify the major support/resistance Levels with Fibs?
- How to Find Entries with Fib Retracements?
- How to Set Targets Using Fib Extensions?
[button_2 color=”red” align=”center” href=”https://ob124-cea4cb.pages.infusionsoft.net/” new_window=”Y”]Fibonacci Retracement An Extensions Workshop • Click To Learn More[/button_2]
Testimonial
This is not your usual service that sends out a ton of stock recommendations, and then cherry picks the winners to show you how great they are. Hit and Run Candlesticks and Right Way Options are truly educational services. They taught me how to trade not what to trade. The entire team: Rick, Doug, Steve, and Ed are there to help and answer your questions. They are awesome. They cut years off my learning curve. And it’s a team effort. Everyone in the room (all the members) are there to help with invaluable insights and advice. The only service you will ever need. Thanks to all the team for how you have helped me and for all you do. –Jonathan Bolnick
***************************************************************************************************
Investing and Trading involve significant financial risk and is not suitable for everyone. No communication from Hit and Run Candlesticks Inc. is to be considered financial or trading advice. All information is intended for Educational Purposes Only. Terms of Service.
Ed Carter is not a licensed financial adviser nor does he offer trade recommendations or advice to anyone.
***************************************************************************************************
The economy is humming right along.
 With last weeks numbers indicating the economy is humming right along with strong jobs growth and wage increase, the Bulls seem ready to mount attacks on resistance levels. The European concerns have passed at least for now, and the US and North Korea summit is back on the schedule. This weekend the President will travel to Canada for the G7 Summit where there could be some tensions after leveling new tariffs on steel and aluminum on them last week.
Trade negotiations on the North American Free Trade Agreement and with China will likely continue to send shock waves through the market over the next several weeks, but Bulls currently seem inspired to move higher with a substantial gap up open to begin the week.
On the Calendar
The Economic Calendar this week gets going at 10:00 AM Eastern with Factory Orders. According to consensus, the durable good report expects orders to slip 0.4 percent in April. After that, there is Bill Announcement, two Bill Auctions, and the TD Ameritrade IMX report to close the calendar day at 12.30 PM.
Earnings Calendar
The Earnings Calendar shows 32 companies will report today to keep traders on toes with the most notable PANW after the bell.
Action Plan
With the Jobs number coming in strong and real wages increasing the Bulls found the inspiration they needed to move higher on Friday. International concerns in Italy and Spain have subsided, and it appears the summit with North Korea is back on for June 6th. Trade negotiations will once again take center stage and continue to weigh heavily on the market particularly with the President traveling to Canada this week.
Currently, the Dow Futures are pointing to more than a 100 point gap up at the open. After breaking resistance on Friday, the QQQ looks ready to attempt a new record high in the near future. The SPY is set to gap above resistance at the open today with the IWM leaning the way looking to post a new record high at the open. As always be very careful not to chase gap up opens as they can often create nasty whipsaws. Having said that, the Bulls do seem set to gain some control as long as trader negotiation jitters remain in check. Go Bulls!
Trade Wisely,
Doug
[button_2 color=”green” align=”center” href=”https://youtu.be/3GYzShdS77Y”]Morning Market Prep Video[/button_2]
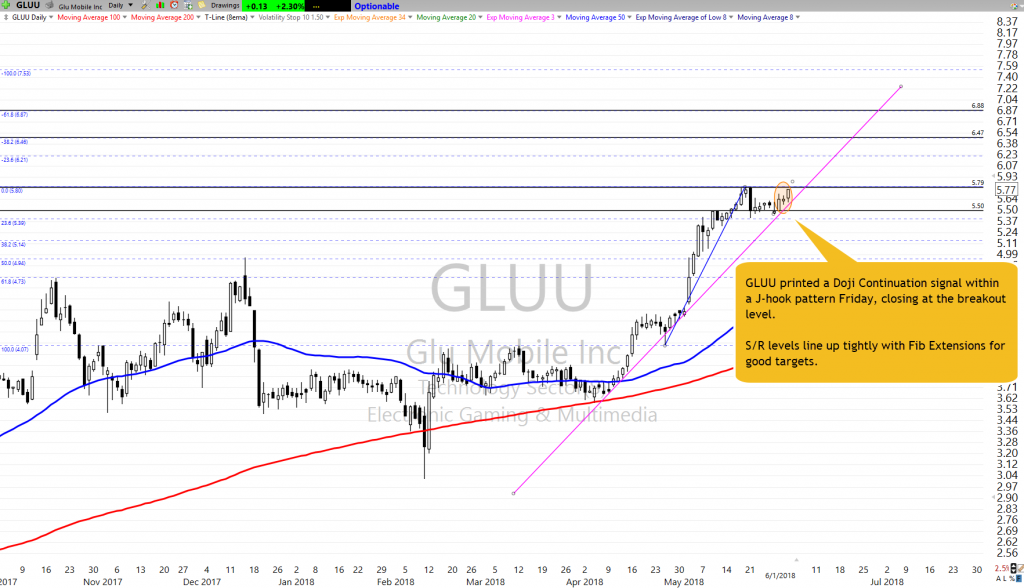
GLUU Recently Broke Out
GLUU had recently broken out and ran 20% before it needed rest to build another bullish continuation pattern. Continuation patterns rarely look as perfect as they do on paper, this is because when on paper the noise is usually cut out. But on a chart, you just can’t photoshop the noise out. Using price resistance and Fibonacci Lines we see 12 to 28% possible target zones in this swing trade. You can find the GLLUU trade Plan under “Free Trade Idea” “TV20/20 Trade Plan”
- Why do Fib Ratios Work?
- Why Should You Use Extensions instead of Projections?
- Answers to Common Problems Using Fibs.
- Where do you begin and end your drawing?
- Do we use Bodies or Wicks?
- Which Ratios should be your focus?
- How to Identify the major support/resistance Levels with Fibs?
- How to Find Entries with Fib Retracements?
- How to Set Targets Using Fib Extensions?
[button_2 color=”red” align=”center” href=”https://ob124-cea4cb.pages.infusionsoft.net/” new_window=”Y”]Fibonacci Tools Provide Price Targets[/button_2]
Don’t miss this powerful Workshop, when you know how Fibs works your work and determining profit zones becomes clear!
SPY Bullish Morning Star
For a Bullish trend you must have followed through, and higher lows and higher highs. Friday we saw follow through from the 3rd major higher low that started in April. Fridays bullish follow through is what was needed to complete the Bullish Morning Star signal from last week. Our Red, White and Blue indicators are still signaling in favor of the Bulls. VXX – The Red, White and Blue indicator is signaling there is not much fear in the VXX chart. Price is also below the T-Line
Rick’s Trade-Ideas Reserved for Members
Monthly • Quarterly • Semi-Annual • Annual
Focus Trading Education
Candlesticks • Price Action • T-Line • T-Line Bands • Support • Resistance • Trend • Trendlines • Chart Patterns • Buy Box • Volatility Stops • Profit Zones • Entry Zones • Protective Stops • RBB Rounded Bottom Breakout Strategy • Pop Out of The Box Strategy • Pinball Strategy • Trade Planning, Fibonacci, Stoch/RSI
To learn more about our trading tools join us in the trading room or consider Private Coaching.
Testimonial
This is not your usual service that sends out a ton of stock recommendations, and then cherry picks the winners to show you how great they are. Hit and Run Candlesticks and Right Way Options are truly educational services. They taught me how to trade not what to trade. The entire team: Rick, Doug, Steve, and Ed are there to help and answer your questions. They are awesome. They cut years off my learning curve. And it’s a team effort. Everyone in the room (all the members) are there to help with invaluable insights and advice. The only service you will ever need. Thanks to all the team for how you have helped me and for all you do. –Jonathan Bolnick
Testimonial
Rare to have a service teach you how they find their choices but, HRC/RWO teach you how to fish instead of fishing for you. And, your ideas are not panned but shared, implemented, or improved. Sharing is caring. –Thomas Bradly
*************************************************************************************
Investing and Trading involve significant financial risk and is not suitable for everyone. No communication from Hit and Run Candlesticks Inc. or Rick Saddler is to be considered financial or trading advice. All information is intended for Educational Purposes Only. Terms of Service.
Rick Saddler is not a licensed financial adviser nor does he offer trade recommendations or advice to anyone.
*************************************************************************************
Politically driven whipsaw.
 It looks like yet another politically driven whipsaw this morning in Dow with the Futures currently pointing to more than a 100 point gap up at the open. The good news is that the Dow managed to hold above the 50-day average yesterday as it struggles to find a balance amidst all the political uncertainty. I believe a politically charged market is one of the most challenging to trade. It can shift directions in half a heartbeat turning profitable positions into losers and vice-versa.
As traders become more and more frustrated, it’s easy to break discipline and begin to trade emotionally. If you find yourself riding this emotional roller-coaster; try to focus on your trade plan and rules or stop trading until you can. Remember trading is business, and there is no room in business for undisciplined emotionally charged decisions.
On the Calendar
It’s been a busy week on the Economic Calendar, and this Friday continues that trend with five potential market-moving reports. Before the market open, forecasters expect Motor Vehicle Sales to hint at a strong month for retail with a 17.1 million annualized rate in May. At 8:30 AM Eastern the Employment Situation consensus is calling for additional strength with a consensus of 190,000 new jobs created in May. The unemployment rate holds steady at 3.9% while wage growth is only up a modest 1 tenth to 2.7 percent. 9:45 AM bring the PMI Mfg. Index where forecasters expect a 56.6 reading in May as orders continue to run at multi-year highs. The ISM Mfg Index at 10:00 AM expects gains to 58.5 in May vs. 57.3 April report with strong growth for new orders continue. Also at 10:00 AM consensus suggests Construction Spending rallied 0.8 percent in April. We have a Fed Speaker at 8:55 AM and the Baker-Hughes Rig Count at 1:00 PM to close the calendar week.
On the Earnings Calendar, we only have 13 companies reporting today.
Action Plan
Another day of politically generated volatility with the Dow narrowly clinging its 50-day average by the close. After waiting a month for a better trade deal, the President is keeping in his promise by imposing tariffs and steal and aluminum on Mexico and the EU. Of course, nations have already fired back with new tariffs of their own as the negotiations continue. Surprisingly markets are up around the world with both Asian and Europian markets showing solid gains. As a result, the Dow Futures are pointing to a gap up open of more than 100 points as the index continues to whipsaw on a daily basis. With the SPY, QQQ, and IWM all holding up quite well I continue to be cautiously bullish. I wish you all a wonderful weekend everyone.
Trade Wisely,
Doug

 The NASDAQ joined the Russell to compete for market leadership as the bulls make an impressive show of force yesterday with both indexes printing new record highs. The SPY broke-out of consolidation while the DIA continues to lag behind although much strongly looking that just a few days ago when it was threatening failure of its 50-day average.