KHC Rounded Bottom Breakout
KHC Rounded Bottom Breakout
KHC a Rounded Bottom Breakout pattern/strategy has presented it’s self as a possible trade. With an Inverted Head and Should chart pattern and a breakout of the 50-SMA and price action leading the way, KHC looks bullish to us. The Bullish Engulf yesterday closed over minor resistance the Dotted Duece and 200-SMA are now target areas. Minor pullbacks are normal and welcomed.
KHC Trade Plan Right Here
HRC Monthly Trading Results Right Here
HRC Current Trading Results January 1, 2018, to June 19, 2018, • Plus 240% or $12,085 profit. Learn and Earn with us.
Monthly • Quarterly • Semi-Annual • Annual
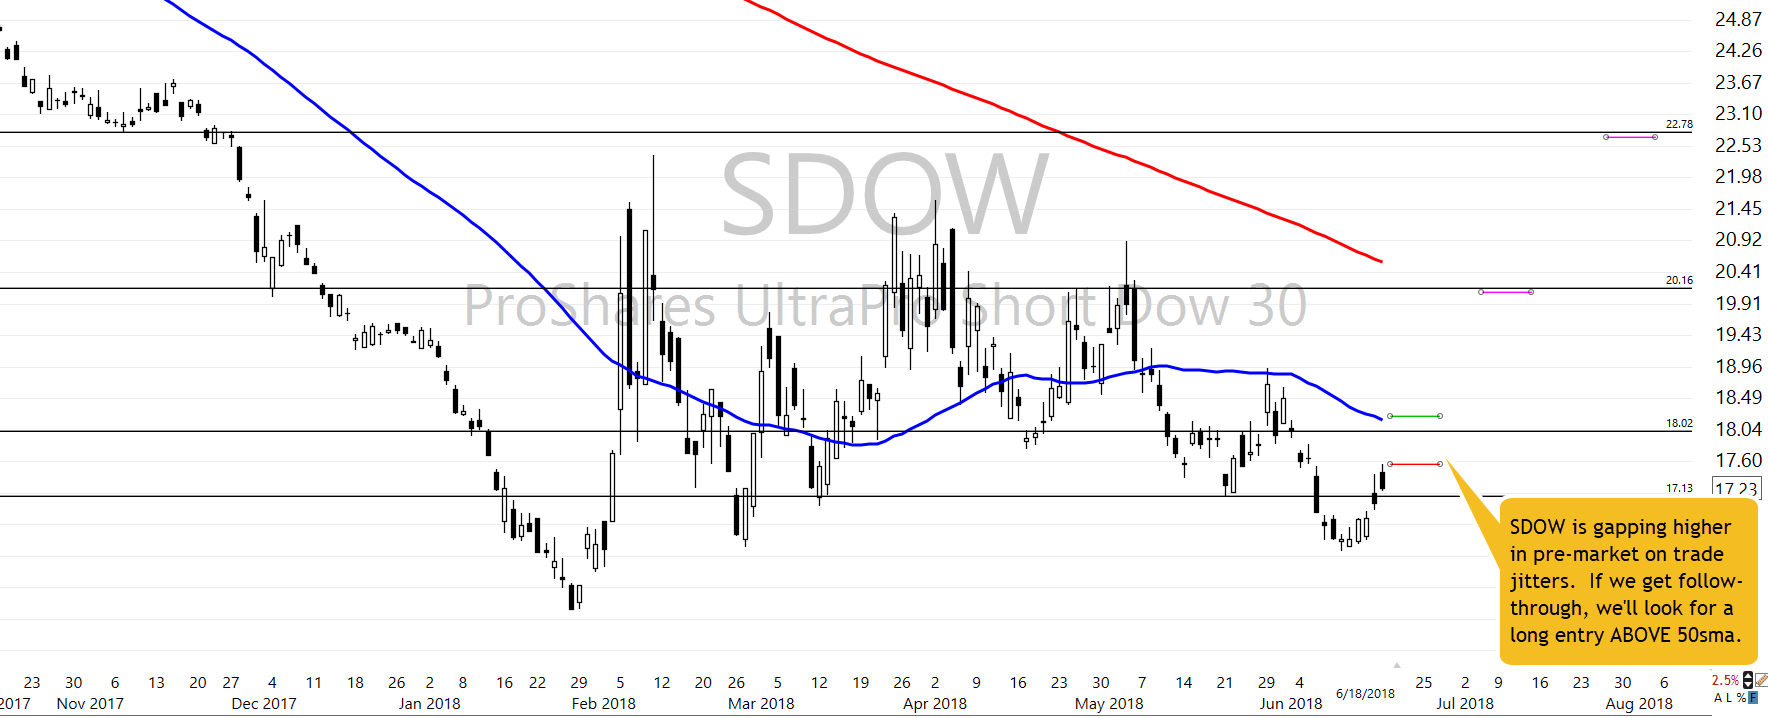
SPY
Yesterday the SPY what pushed down to the 34-EMA and the May support line where is found a few buyers hanging out. During the day price action worked it was self up and closed back over the 20-SMA. So far the morning futures are leaning toward the buyer’s side. If yesterdays low holds we are building a nice higher low higher high stair step. Remember it the base hits that count
VXX – The VXX tried yesterday but no real success
Rick’s Trade-Ideas Reserved for Members
Focus Trading Education
Candlesticks • Price Action • T-Line • T-Line Bands • Support • Resistance • Trend • Trendlines • Chart Patterns • Buy Box • Volatility Stops • Profit Zones • Entry Zones • Protective Stops • RBB Rounded Bottom Breakout Strategy • Pop Out of The Box Strategy • Pinball Strategy • Trade Planning, Fibonacci, Stoch/RSI
To learn more about our trading tools join us in the trading room or consider Private Coaching.
Testimonial
This is not your usual service that sends out a ton of stock recommendations, and then cherry picks the winners to show you how great they are. Hit and Run Candlesticks and Right Way Options are truly educational services. They taught me how to trade not what to trade. The entire team: Rick, Doug, Steve, and Ed are there to help and answer your questions. They are awesome. They cut years off my learning curve. And it’s a team effort. Everyone in the room (all the members) are there to help with invaluable insights and advice. The only service you will ever need. Thanks to all the team for how you have helped me and for all you do. –Jonathan Bolnick
Rare to have a service teach you how they find their choices but, HRC/RWO teach you how to fish instead of fishing for you. And, your ideas are not panned but shared, implemented, or improved. Sharing is caring. –Thomas Bradly
Investing and Trading involve significant financial risk and is not suitable for everyone. No communication from Hit and Run Candlesticks Inc. or Rick Saddler is to be considered financial or trading advice. All information is intended for Educational Purposes Only. Terms of Service.
Rick Saddler is not a licensed financial adviser nor does he offer trade recommendations or advice to anyone.
*************************************************************************************