TNDM Has Been Riding the T-Line Benefits of a trend "Money"
TNDM Has Been Riding the T-Line
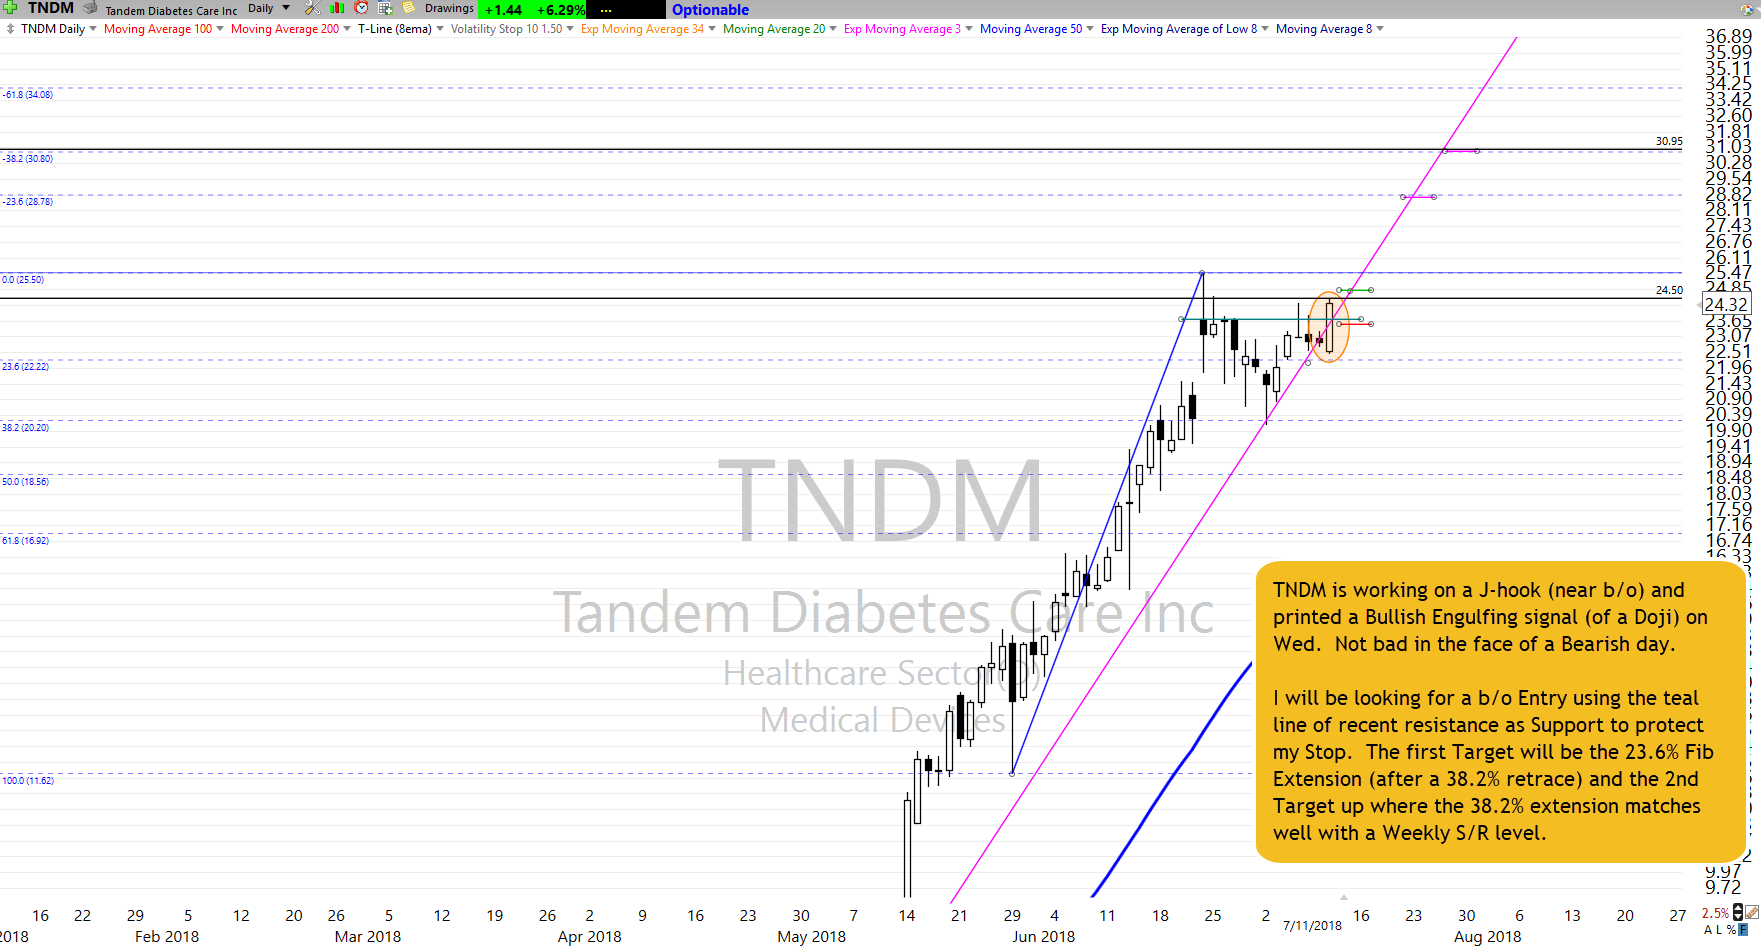
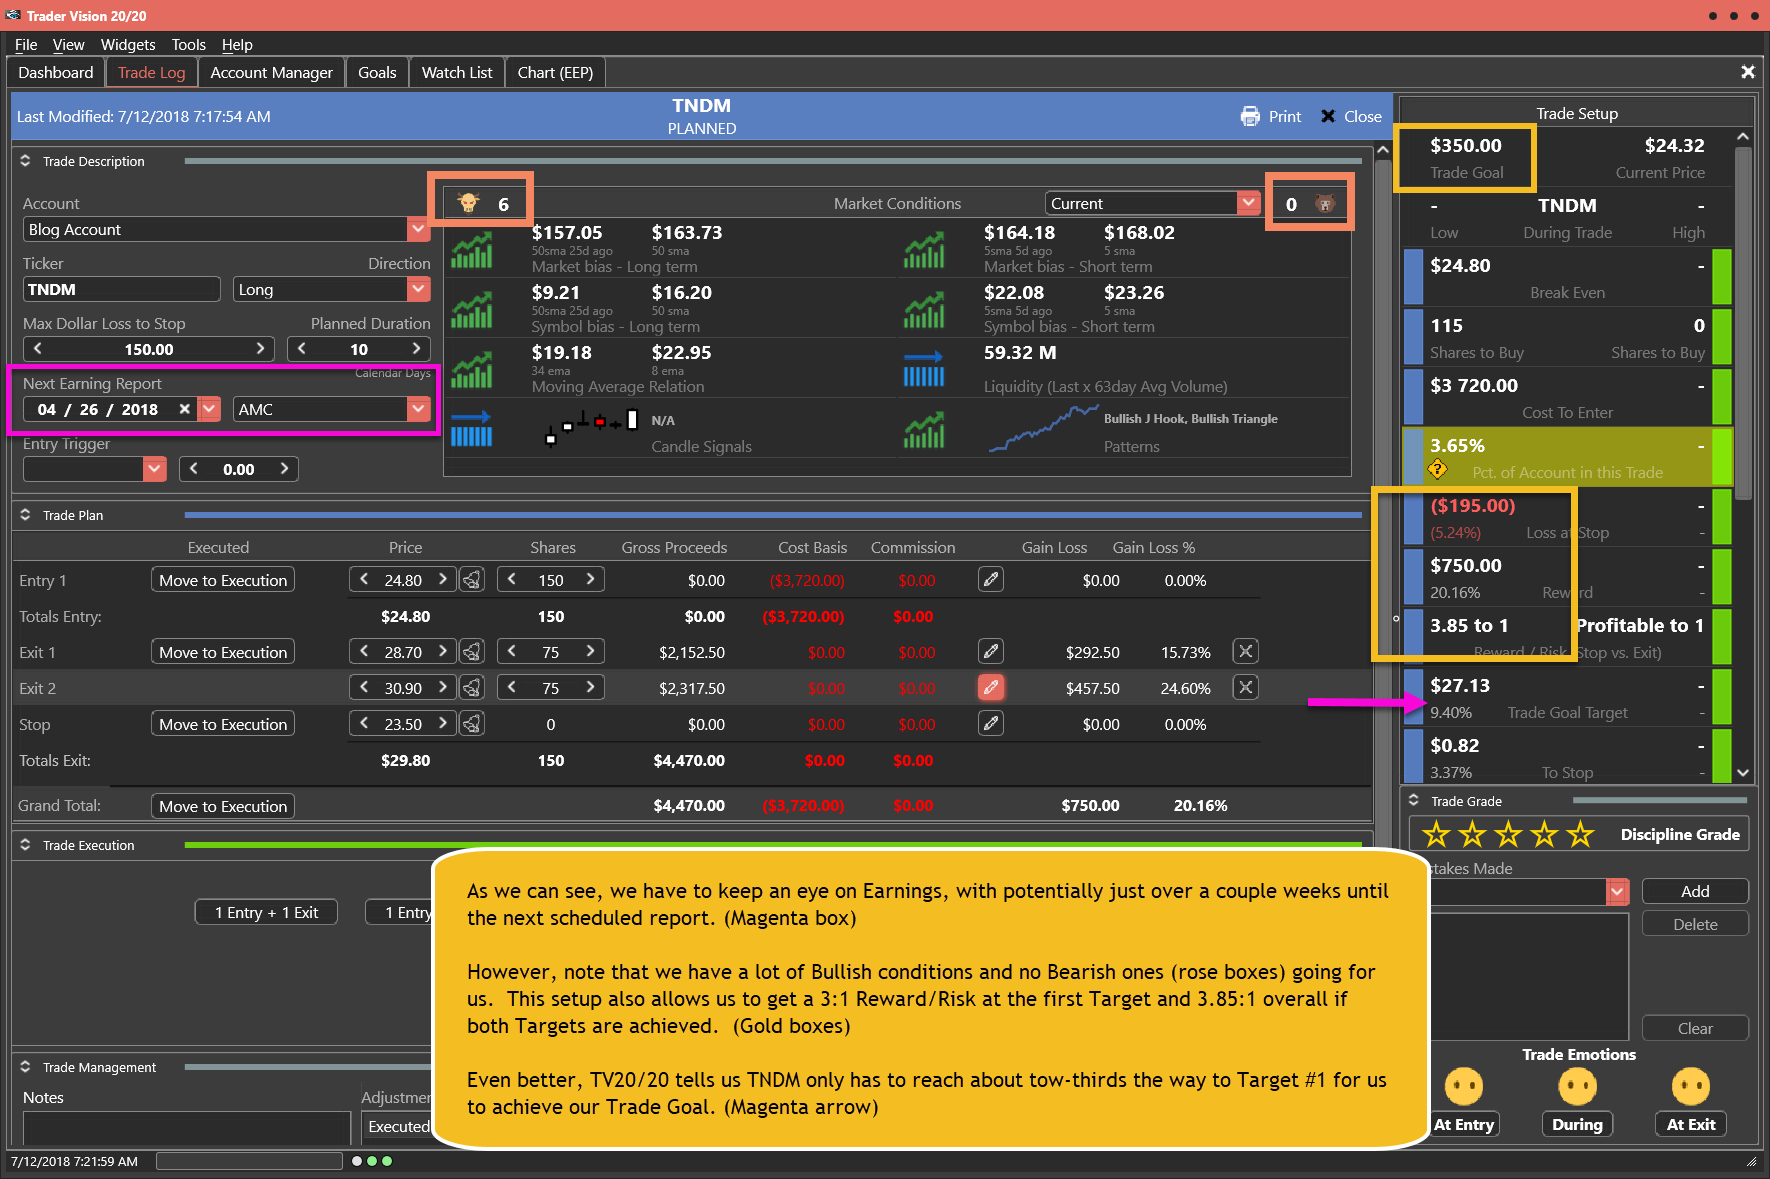
TNDM has been riding the T-Line showing us what a great trend looks like. If you switch to a 2-day chart, you can see a beautiful Bullish Inverted Head and Shoulder pattern with a Doji Flag Bullish Engulf pattern. I am bullish on the chart and buying bullish above $24.50 and a short to a medium-term target zone of about 30% with a larger longer-term target.
[button_1 text=”15%25%20Ends%20On%20Friday%207%2F13%2F18″ text_size=”29″ text_color=”#000000″ text_font=”Montserrat;google” text_bold=”Y” text_letter_spacing=”0″ subtext_panel=”Y” subtext=”Profit%2C%20Success%2C%20Freedom%2C%20Benefits%20Of%20A%20Trend” subtext_size=”20″ subtext_color=”#3855fa” subtext_bold=”Y” subtext_italic=”Y” subtext_letter_spacing=”0″ text_shadow_panel=”N” styling_width=”40″ styling_height=”30″ styling_border_color=”#000000″ styling_border_size=”1″ styling_border_radius=”6″ styling_border_opacity=”100″ styling_gradient_start_color=”#4ca81e” styling_gradient_end_color=”#4ca81e” drop_shadow_panel=”N” inset_shadow_panel=”N” align=”center” href=”https://ob124-e13140.pages.infusionsoft.net” new_window=”Y”/]
TNDM Has Been Riding the T-Line
With less than 5% risk and about 30% plus reward, we believe TNDM is a perfect candidate for our watchlist. Get the complete trade details TV2020 trade plan right here
Past performance is not indicative of future returns
HRC Monthly Trading Results Right Here Each, and every day we not only share trade ideas we also share how we plan to trade them.
Monthly • Quarterly • Semi-Annual • Annual • Private 2-Hour Coaching
SPY, Be Ready To Dance
We gap down we gap up yadda yadda yadda, bullish follow through and close above $278.40 would suggest the bulls have come back to the game. Yesterday’s price action held the 23.6 Fib retracement and above the T-Line. I am very surprised that we are gapping up this morning and not meeting up with the T-Line. Remember price is king and always be ready to dance with it.
VXX – The VXX is still below the T-Line trying to put together a team.
Members Login for what Rick is adding to his trade watch list Right Here
Focus Trading Education
Candlesticks • Price Action • T-Line • T-Line Bands • Support • Resistance • Trend • Trendlines • Chart Patterns • Buy Box • Volatility Stops • Profit Zones • Entry Zones • Protective Stops • RBB Rounded Bottom Breakout Strategy • Pop Out of The Box Strategy • Pinball Strategy • Trade Planning, Fibonacci, Stoch/RSI
To learn more about our trading tools join us in the trading room or consider Private Coaching.
Testimonial
This is not your usual service that sends out a ton of stock recommendations, and then cherry picks the winners to show you how great they are. Hit and Run Candlesticks and Right Way Options are truly educational services. They taught me how to trade not what to trade. The entire team: Rick, Doug, Steve, and Ed are there to help and answer your questions. They are awesome. They cut years off my learning curve. And it’s a team effort. Everyone in the room (all the members) are there to help with invaluable insights and advice. The only service you will ever need. Thanks to all the team for how you have helped me and for all you do. –Jonathan Bolnick
Rare to have a service teach you how they find their choices but, HRC/RWO teach you how to fish instead of fishing for you. And, your ideas are not panned but shared, implemented, or improved. Sharing is caring. –Thomas Bradly
Past performance is not indicative of future returns
Investing and Trading involve significant financial risk and is not suitable for everyone. No communication from Hit and Run Candlesticks Inc, Right Way Option, Trader Vision 2020 or Rick Saddler, Doug Campbell, Ed Carter, Steve Risner is to be considered financial or trading advice. All information is intended for Educational Purposes Only. Terms of Service.
Rick Saddler, Doug Campbell, Ed Carter, Steve Risner is not a licensed financial adviser nor do they offer trade recommendations or advice to anyone.