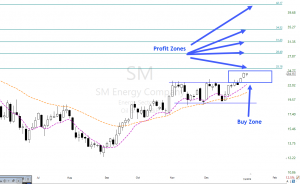
Weekly Doji Continuation Pattern
 The weekly Doji continuation pattern on SM has recently broken out of a bullish rectangle pattern – On the daily chart, The T-Line is rising after a breakout of resistance with price resting with two dojis and support. The breakout pattern suggests the buyers think has not reached its potential. A major profit zone that you might consider is the $42.00 area with several mini profit zones on the way.
At 9:10 AM ET. We will talk about the technical properties of SM with target zones, a couple of logical entries and a protective stop.
► Must Read Trade Update (OSTK)
On January, we shared, in detail, the technical chart properties of OSTK in the Trading Room and why we thought this chart was ready for a run. Friday the profits would have been about 17.90% or $1280.00. Using our simple tools and techniques to achieve swing trade profits.
► Simple Proven Swing Trade Tools
T-Line • T-Line Bands • Chart Patterns • Support • Resistance • Trendlines • Chart Patterns • Buy Box • Volatility Stops • Price Action • Candlesticks • Profit Zones • Entry Zones • Protective Stops • RBB Pattern • Pop Out of The Box Pattern
► Eyes On The Market
Friday marked another four days positive run for the S&P-500, and it’s ETF the SPY. This 4-day run may need a little rest and pullback. Price has moved pretty far from the T-Line, and it has been my experience that when this happens price stalls out to allow the T-Line to catch up. Resting pullback can be very shallow or even test the previous day’s support. Below $272.95, we could see $272.60 and below $272.60 and below $272.60 we could see $271.80, so on, so on, so on.
The VXX short-term futures may be trying to get off the ground, above $26.90 and we may have to take the VXX a little serious.
Rick’s Swing Trade ideas – MEMBERS remember to log into the members’ blog for the trade ideas – Member Login
30-Day Trial • Monthly • Quarterly • Semi-Annual • Annual
Learn how and what we trade: The T-Line • T-Line Bands • Chart Patterns • Support • Resistance • Patterns • Buy Box • Volatility Stops • Price Action • Candlesticks • Profit Zones • Entry Zones • Protective Stops • RBB Pattern • Pop Out of The Box Pattern
Investing and Trading involves significant financial risk and is not suitable for everyone. No communication from Hit and Run Candlesticks Inc. is financial or trading advice. All information is intended for Educational Purposes Only. Terms of Service.
Rick Saddler is not a licensed financial adviser nor does he offer trade recommendations or advice to anyone except for the trading desk of Hit and Run Candlesticks Inc.
*************************************************************************************


Comments are closed.