So that’s
how it feels when the DOW drops 500 points on a Sunday night. Sure glad we use
Fridays as a day to delete a little of our inventory. If a trader has been
following a T-Line strategy, you would have been making money from the first
pullback after the December low. Overall a gap down this morning should not affect
the portfolio that much. Yes, there may be some losses taken today but not to
the extent of the gains the past 4-months. My plan of action today is brewed a
cup of coffee and pick up a box of donuts on the way to work. Manage the
positions I have to take a few profits/losses maybe. But the last thing I am
going to do is buy new positions without the proper chart set up or because of
desperation. Its times like this that your business decisions are the most important
and your trading is your business. $287.00, $284.75, $281.75 will be important price
targets for the bears to capture and the bulls to defend.
✅ Profitable trading takes time and education, and a trader must have the proper tools. Hope to see you in the trading room and our educational workshops.
✅ 💰 Because of the pre-market price action, we will wait for the market to settle and the LTA Scanner alerts for trade ideas.👇
DISCLAIMER: Investing / Trading involves significant financial risk and is not suitable for everyone. No communication from Hit and Run Candlesticks Inc, its affiliates or representatives is not financial or trading advice. All information provided by Hit and Run Candlesticks Inc, its affiliates and representatives are intended for educational purposes only. You are advised to test any new trading approach before implementing it. Past performance does not guarantee future results. Terms of Service
The SPY printed a Bearish Engulf yesterday after making a new high, and the VIX closed over $14.25. I have mentioned in the trading room we should be concerned if the VIX can close over $14.25. Yesterday ended the T-Line Run streak by price closing below the T-Line. If you use the Red/Green alert T-Line you know that is has turned Red, follow through on price will drag the 3-EMA below the T-Line causing a 3×8 trend to start. Price action, trend and support will be very important in the next few days. If we see weakness and follow-through on the bearish engulf I suspect $288.40 could get tested. Of course, the bulls could eat a Snickers Bar and bring us back, a close over $293.40 might bring the die-hard bulls back in the game. Yesterday going into the close we bought IWM puts, Double Top, Evening Star, 2-day Bearish Engulf, Price closing below the T-Line and the 3-SMA following. We also bought VXXB long ending the day with 21%
✅ Profitable trading takes time and education, and a trader must have the proper tools. Hope to see you in the trading room and our educational workshops.
✅ The following are twelve trade ideas I am adding to my watch-list for consideration over the next few days. SDS, TZA, VXXB, QID, DXD, SDS, KEYS, SHOP, ATVI, LABD, SEE, INTU. I will use the LTA Scanner to alert me on these and other setups created.👇
DISCLAIMER: Investing / Trading involves significant financial risk and is not suitable for everyone. No communication from Hit and Run Candlesticks Inc, its affiliates or representatives is not financial or trading advice. All information provided by Hit and Run Candlesticks Inc, its affiliates and representatives are intended for educational purposes only. You are advised to test any new trading approach before implementing it. Past performance does not guarantee future results. Terms of Service
A typical FOMC day is usually dreary until the Fed decisions come out in the early afternoon. Before the FED decision, everyone scramble for a position and changes their mind 2-3 times while sitting on the edge of their seat. Stay calm and have a slice of pie is what I plan to do. It really is pretty simple, if the Fed news is to risky think about cash or nearly cash. If you are comfortable with your positions and they have proper stops sit back and enjoy the pie. And never forget you don’t have to trade every day and never trade out of desperation. THE SPY CHART had a hard morning yesterday thanks to GOOG, but by the end of the day the SPY came back above our T-Line making it 23 days that price has closed above the T-Line, (what a nice run). The bears are always sitting on the edge waiting for a sign to pounce on the bull in a bullish trend, and we will also be alerted with price action and candlesticks formations. Good trading traders!
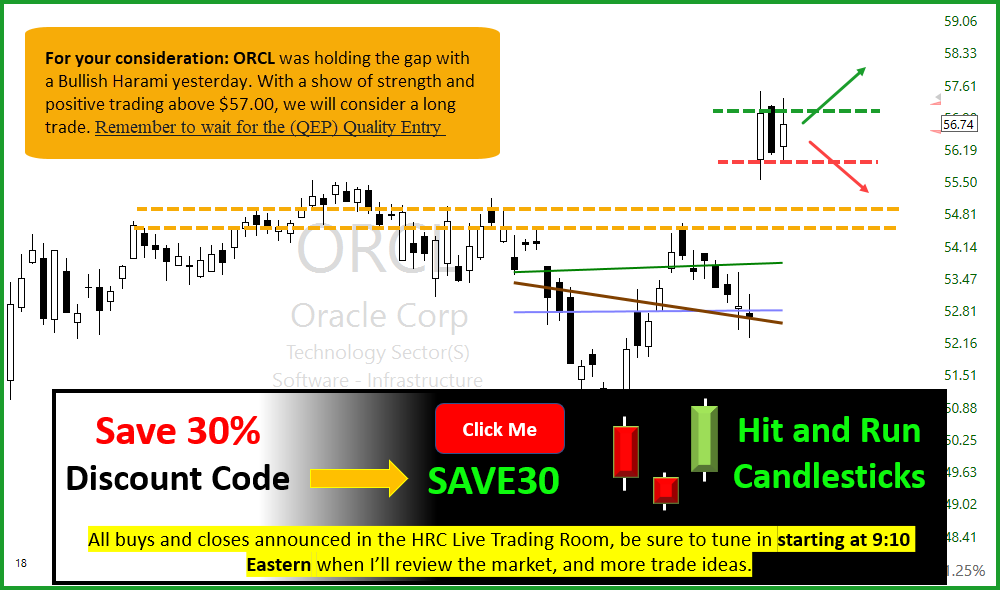
✅ The following are eleven trade ideas I am adding to my watch-list for consideration over the next few days. CMRE, PG, JNJ, ADSK, ACN, ORCL, UNP, CSX, ECL, BMO, CCK
DISCLAIMER: Investing / Trading involves significant financial risk and is not suitable for everyone. No communication from Hit and Run Candlesticks Inc, its affiliates or representatives is not financial or trading advice. All information provided by Hit and Run Candlesticks Inc, its affiliates and representatives are intended for educational purposes only. You are advised to test any new trading approach before implementing it. Past performance does not guarantee future results. Terms of Service
GOOG was spanked last night at the earnings party, and the FNGU has dropped $2.00 in the aftermarket. I suspect today will a nail-biting day for some and others dance in the street. The difference is how the trade plans, quality of charts and allotment size that makes the difference. Either way, the SPY closed good, now 22 days in a Bullish T-Line Run. Yesterday’s close was in the form of a small-bodied candle and a small wick/shadow on top so we could see a little profit taking in the market today. Above $291.35 I will view a bullish and below not so much. Above $291.35 keep price above the 4/17 bearish engulf candle that the 4/23 candle broke out of. We close out our BAC trade for a cool 30%; we entered the trade because we liked the chart after the LTA Scann alerted us a 3×8 Trap Scan and it was a T-Band Breakout.
📽 In my youtube channel, you will find hundreds of videos. It’s free and can be very educational. I hope you take some time and look them over.
✅ The following are seven trade ideas I am adding to my watch-list for consideration over the next few days. V, MS, LUV, GS, FRO, DLTR, C
DISCLAIMER: Investing / Trading involves significant financial risk and is not suitable for everyone. No communication from Hit and Run Candlesticks Inc, its affiliates or representatives is not financial or trading advice. All information provided by Hit and Run Candlesticks Inc, its affiliates and representatives are intended for educational purposes only. You are advised to test any new trading approach before implementing it. Past performance does not guarantee future results. Terms of Service
The Wall of Worry can make for crazy trading days and days of boredom as we have seen in the past few weeks. Friday was the 21st day the SPY has closed over the T-Line which suggest the market is happy with last weeks round of earnings. Today is the start of another full week of earnings and the sane can be applied. Each day we will have earnings and each day we will monitor price action and where it is in relationship to the T-Line. If the price closes below the T-Line but closes in the band, consolidation, and opportunity maybe around the corner. Closing below the bands altogether puts the sellers in the driver seat, and we may have to alter our direction. Let’s keep watch on the VIX- chart; price is curtly flirting with the 200-SMA on the 15-min chart, And the 200-SMA is tilted upwards because of the big move the VIX- did a few bars back.
📽 In my youtube channel, you will find hundreds of videos. It’s free and can be very educational. I hope you take some time and look them over.
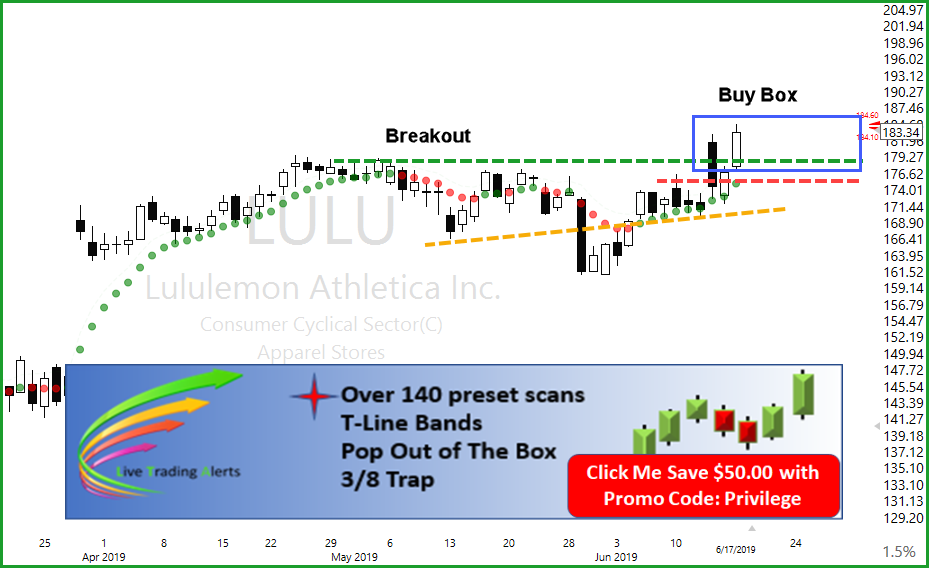
✅ The following are eight trade ideas I am adding to my watch-list for consideration over the next few days.. URI, TXN, SYMC, NKE, LULU, GS, ANF, ADBE.
DISCLAIMER: Investing / Trading involves significant financial risk and is not suitable for everyone. No communication from Hit and Run Candlesticks Inc, its affiliates or representatives is not financial or trading advice. All information provided by Hit and Run Candlesticks Inc, its affiliates and representatives are intended for educational purposes only. You are advised to test any new trading approach before implementing it. Past performance does not guarantee future results. Terms of Service
The SPY closed with a Doji yesterday above the T-Line and the T-Line Bands in a bullish trend. Yesterday produced a pretty good battler between the buyers and sellers. The DIA’s made it down to the lower band support line and close up near the mid support band line. The VIX-X chart also played in yesterdays fun popping up to $13.29 before closing at $13.25. The VIX-X closed over the T-Bands with higher lows and a little bottom construction. I doubt the VIX-X is finished with it’s fun in the playground. There is a bit of fear starting to brew, and the VIX-X chart is a great place to watch it unfold. Note that if the Fear rises the SPY may fall below the T-Line and test the lower T-Band. Buckle up; it’s Friday.
DISCLAIMER: Investing / Trading involves significant financial risk and is not suitable for everyone. No communication from Hit and Run Candlesticks Inc, its affiliates or representatives is not financial or trading advice. All information provided by Hit and Run Candlesticks Inc, its affiliates and representatives are intended for educational purposes only. You are advised to test any new trading approach before implementing it. Past performance does not guarantee future results. Terms of Service
Pre-market earnings on MMM giving the market a little spanking. It Looks like the DIA’s will be testing around the T-Line today after closing bullishly above the T-Line for the past 8-days. VXXB closed yesterday with a Bullish Morning Star pattern suggesting the nervous traders are getting a bit more nervous, and the FANG ETF chart is whipping around this morning. The SPY seems to be holding up in the Pre-market, but it’s early as I write this blog. It’s looking like today will test the confidence of many traders, having a solid risk plan on each position held will help to keep calm and focused. The close yesterday suggested the market was in for a little profit taking today, even with minor (emphasis on minor) profit taking the SPY and the overall market is still trending. The Live Trading Alerts Scanner will be very helpful today with charts alerting Bullish or Bearish Action.
✅ Hit and Run Candlesticks trade Ideas for consideration: TXN, PLUG, FDX, DG, ANF, AMAT, PCG, VXXB
DISCLAIMER: Investing / Trading involves significant financial risk and is not suitable for everyone. No communication from Hit and Run Candlesticks Inc, its affiliates or representatives is not financial or trading advice. All information provided by Hit and Run Candlesticks Inc, its affiliates and representatives are intended for educational purposes only. You are advised to test any new trading approach before implementing it. Past performance does not guarantee future results. Terms of Service
The Live Trading Alerts Software is 100% instrumental to my personal trading. Finding the trades, entering the trades, managing the trades, and profiting alerts. Yesterday April 23, 2019 I pulled 30.5% off AAPL a head of earnings. We love base hits!
DISCLAIMER: Investing / Trading involves significant financial risk and is not suitable for everyone. No communication from Hit and Run Candlesticks Inc, its affiliates or representatives is not financial or trading advice. All information provided by Hit and Run Candlesticks Inc, its affiliates and representatives are intended for educational purposes only. You are advised to test any new trading approach before implementing it. Past performance does not guarantee future results. Terms of Service