
Rick’s Featured Trade Ideas
I/Long |Breakout | RBB | Morning Star Signal |PBO J-Hook
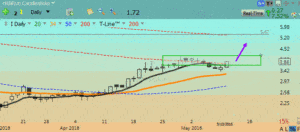
I| Plan your trade & trade your plan | May 11, 2016
Possible entry plan idea: Buy box $3.64- $4.18
Possible stop plan idea: Protective stop below $3.64
Swing trade playground: $3.64 – $5.47 = 49%
Playground risk reward: 6:1 + depending on | entry | exit | stop
 Yesterday’s featured trade idea SONS was bought at $8.52 while in the buy box. The chart remains bullish with a doji candlestick yesterday closing over the T-Line.
Last night we had a great members’ e-learning class talking about the rising 20-day simple moving average and utilizing On Balance Volume (OBV), using both of them to narrow down your watch list for your trade ideas.
SPY: T-Line ™ chart suggest the buyers are in control
7:00 am: Another terrific swing trading day yesterday with the SPY closing at $208.45 or 1.24%. The Bullish Engulf, Doji, followed by a positive, bullish close is what we call a Doji continuation pattern. This pattern suggests the Bulls are in control, and it looks like they may be headed for the April 20 high. Of course, this is contingent on the bulls controlling the $207.00 line. As seasoned traders, we know that price may consolidate for a day or two before moving up, and as seasoned traders, we know to have patience and allow the chart to work. We also know as seasoned traders to be respectful of price action if it runs into trouble and to pay attention to support and resistance.
The SPY and the DIA closed over the 20-day simple moving average yesterday, and today, tomorrow or Friday, all eyes will be on IWM, IYT and the QQQs to see if they can follow and capture the 20-day simple moving average.
Trading knowledge ignites successful stock trading.
All the best to your trading success!
Rick
IWM: Daily chart |Above $111.70 bullish | Below $110.98 weak
SMH: Daily chart |Above $52.46 bullish | Below $51.87 weak
IYT: Daily chart |Above $140.64 bullish | Below $138.64 weak
VIX: Daily chart | Above $15.22 bullish | Below $14.38 weak
USO: Daily chart | Above $10.99 bullish | Below $10.81 weak
UUP: Daily chart | Above $24.32 bullish | Below $24.20 weak
Each day 10 -15 stocks are posted in the members area that I believe are poised to move 10-20% (or more) within the next few days. Please follow your trading rules for entry stops and profits. Remember to check for earnings!
Members Only
Keep your eye on the inverse ETF’s They trade well!
Investing and Trading involves significant financial risk and is not suitable for everyone. No communication or chat sessions should be considered as financial or trading advice. All information is intended for Educational Purposes Only.
To see all of today’s trade ideas Click Here
2-sma > T-Line™ = Minor trend up
T-Line™ > 34-ema = Intermediate trend up
2-sma < T-Line™ = Minor trend down
T-Line™ < 34-ema = Intermediate trend down
| Click Here | for members login | Trade Ideas & | House trade list |
| Bullish Above | Weak Below | |
| 28.96 | 27.77 | |
| 14.34 | 14.06 | |
| 41.80 | 40.31 | |
| 95.92 | 92.90 | |
| 118.75 | 117.08 | |
| 91.98 | 90.70 | |
| 213.72 | 208.22 | |
| 671.71 | 656.28 | |
| 13.44 | 13.28 |
VXX S&P 500 VIX Short Term Futures: A close above the T-Line ™ implies the bullish short-term swing traders are in control. A close below the T-Line ™ implies the bearish short-term swing traders are in control.
Energy Sector: XLE, SX90, ERX, USO A close above the T-Line ™ implies the bullish short-term swing traders are in control. A close below the T-Line ™ implies the bearish short-term swing traders are in control.
SMH: A close above the T-Line ™ implies the above short-term swing traders are in control. A close below the T-Line ™ implies the bearish short-term swing traders are in control.
IYT: A close above the T-Line ™ implies the above short-term bullish swing traders are in control. A close below the T-Line ™ implies the bearish short-term swing traders are in control.
US Dollar Index: UUP, DXYO A close above the T-Line ™ implies the bullish short-term swing traders are in control. A close below the T-Line ™ implies the bearish short-term swing traders are in control. Learn more about the T-Line – Click Here
The information in this email and Blog Post are notes to myself and should NOT be construed as financial or trading advice.
Investing and Trading involves significant financial risk. No communication should be construed as financial or trading advice. All information provided is for Educational Purposes Only.
Investing and Trading involves significant financial risk and is not suitable for everyone. No communication or chat sessions should be considered as financial or trading advice. All information is intended for Educational Purposes Only.
http://hitandruncandlesticks.com Trading for Profit is not an investment advisory service, nor a registered investment advisor or broker-dealer and does not tell or suggest which securities or currencies customers or subscriber should buy or sell. The analysts and employees or affiliates of Company may hold positions in the stocks, currencies or industries discussed here.


Comments are closed.