
Rick’s Featured Trade Ideas
Today’s featured trade idea and my personal trade plan
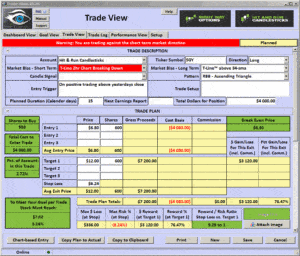
SGY/Long | RBB| Ascending Triangle
 SPY: T-Line™ Chart: Needs confirmation
Good Morning, Profit Traders,
Last week I talked about the 34-EMA and the T-Line™ and how I use them together. The T-Line is still above the 34-EMA on the SPY, but the candlesticks are looking very weak as if they are about to let the T-Line™ drop below the 34-EMA.
Two intraday charts that I follow are the 2-hour and 4-hour charts, and on both, the T-Line™ has cut through the 34-EMA and now hangs below.
On the hourly chart, the T-Line™ is only above the 34-EMA because of yesterday’s gap, and it looks as if any weakness today will drop it back below the 34-EMA.
Price action on the 2-hour chart is suggesting that the Bulls are very vulnerable if they continue to hang out below $209.15. Below $207.15 and I’m afraid the Bulls will be in a headlock getting nooggies from the bears.
All the best to your trading success!
Rick | Hit and Run Candlestick Team
Trading knowledge ignites successful stock trading.
IWM: T-Line™ 2-hour chart |Below 114.60 is trouble
SMH: T-Line™ 2-hour chart |Below 56.40 is trouble
IYT: T-Line™ 2-hour chart |Below 137.50 is trouble
XME: T-Line™ Daily chart | Cup & Handle setting up needs follow through
USO: T-Line™ Daily chart |Bullish above T-Line™
UUP: T-Line™ Daily chart | Under pressure and under support
VIX: T-Line™ Daily chart | T-Line™ chart still bullish
Each day a trade idea list is posted in the members area that I believe are poised to move 10-20% (or more) within the next few days. Please follow your trading rules for entry stops and profits. Remember to check for earnings!
Members Only
Keep your eye on the inverse ETF’s They trade well!
Investing and Trading involves significant financial risk and is not suitable for everyone. No communication or chat sessions should be considered as financial or trading advice. All information is intended for Educational Purposes Only.
VXX S&P 500 VIX Short Term Futures: A close above the T-Line ™ implies the bullish short-term swing traders are in control. A close below the T-Line ™ implies the bearish short-term swing traders are in control.
Energy Sector: XLE, SX90, ERX, USO A close above the T-Line ™ implies the bullish short-term swing traders are in control. A close below the T-Line ™ implies the bearish short-term swing traders are in control.
SMH: A close above the T-Line ™ implies the above short-term swing traders are in control. A close below the T-Line ™ implies the bearish short-term swing traders are in control.
IYT: A close above the T-Line ™ implies the above short-term bullish swing traders are in control. A close below the T-Line ™ implies the bearish short-term swing traders are in control.
US Dollar Index: UUP, DXYO A close above the T-Line ™ implies the bullish short-term swing traders are in control. A close below the T-Line ™ implies the bearish short-term swing traders are in control. Learn more about the T-Line – Click Here
The information in this email and Blog Post are notes to myself and should NOT be construed as financial or trading advice.
Investing and Trading involves significant financial risk. No communication should be construed as financial or trading advice. All information provided is for Educational Purposes Only.
Investing and Trading involves significant financial risk and is not suitable for everyone. No communication or chat sessions should be considered as financial or trading advice. All information is intended for Educational Purposes Only.
http://hitandruncandlesticks.com Trading for Profit is not an investment advisory service, nor a registered investment advisor or broker-dealer and does not tell or suggest which securities or currencies customers or subscriber should buy or sell. The analysts and employees or affiliates of Company may hold positions in the stocks, currencies or industries discussed here.


Comments are closed.