Fifth Bar At The Support Level
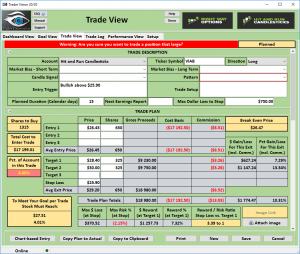
 VIAB – Yesterday was the fifth bar at the $25.16 (ish) support level. After strong a run up the consolidation is taking place with a flag forming. This chart pattern is also what we call a [PBO] Pull Back Opportunity. Price rises, and then minor profit takes place when the buyers start to step in this a PBO. Be aware of recent price action, support, and resistance, and profit opportunities.
30-Days in the Trading Room could be a game changer for you.
Good Trading – Hit and Run Candlesticks
► Members’ Trade Idea Update (ZYNE)
On October 3 we shared and went over the technical properties of ZYNE, today the profits would be about 56% or $492.00, with 100 shares.
Learn how and what we trade: The T-Line • T-Line Bands • Support • Resistance • Buy Box • Volatility Stops • Price
Action • Candlesticks • Profit Zones • Entry Zones • Protective Stops.
► Eyes On The Market
(SPY) The battle between the buyers and sellers was pretty much even yesterday, The candle action of yesterday was the [Doji Indecision thing]. Price above the T-Line and the High T-Line says the sellers did not have enough juice yesterday. As of yesterday below $258.40 would suggest the sellers are mounting an attack on the buyers. IWM felt the seller’s bit yesterday, below $147.90 would give the sellers a little juice.
Rick’s trade ideas for the day – MEMBERS ONLY
30-Day Trial • Monthly • Quarterly • Semi-Annual • Annual
Investing and Trading involves significant financial risk and is not suitable for everyone. No communication from Hit and Run Candlesticks Inc. is financial or trading advice. All information is intended for Educational Purposes Only. Terms of Service.
Rick Saddler is not a licensed financial adviser nor does he offer trade recommendations or advice to anyone except for the trading desk of Hit and Run Candlesticks Inc.


Comments are closed.