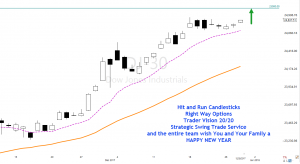
DJ-30 + 160.77 = 25K
 Will the DJ-30 it to 25K this year? The chart is a position to make the run. Over the past few days, the price action has been building a J-Hook continuation pattern, at this point the bull team needs to push over the recent high of $24876.07 and the hope for a gust of wind to carry the industrial bird to the altitude of 25K
At 9:10 AM ET. We will talk about the technical properties of charts with target zones, logical entries, and protective stops.
► Eyes On The Market
We saw the market a nice lift going into the close yesterday from the SPY, look at the chart, and you can see how price action has been carving out a reversal bottom near the support of the V-Stop and the Lower T-Line Band. Those are two tools that winners use by the way. IWM and the DIA’s saw bullish interest into the close yesterday while the QQQ’s was just plain lazy. I truly wish the best for the DJ-30 finding the perfect landing spot on 25K
Rick’s Swing Trade ideas – MEMBERS ONLY
30-Day Trial • Monthly • Quarterly • Semi-Annual • Annual
Learn how and what we trade: The T-Line • T-Line Bands • Chart Patterns • Support • Resistance • Patterns • Buy Box • Volatility Stops • Price Action • Candlesticks • Profit Zones • Entry Zones • Protective Stops
Investing and Trading involves significant financial risk and is not suitable for everyone. No communication from Hit and Run Candlesticks Inc. is financial or trading advice. All information is intended for Educational Purposes Only. Terms of Service.
Rick Saddler is not a licensed financial adviser nor does he offer trade recommendations or advice to anyone except for the trading desk of Hit and Run Candlesticks Inc.
*************************************************************************************


Comments are closed.