Swing Trade Ideas May 2, 2016 Watch our T-Line™ chart for turn clues

Rick’s Featured Trade Ideas

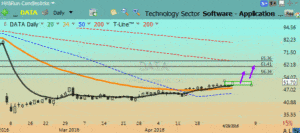
DATA/Long (Software) | RBB | Rising T-Line™ |PBO breakout |

DATA| Plan your trade & trade your plan | May 2, 2016
Possible entry plan idea:   Buy box $49.72- $51.83
Possible stop plan idea:   Protective stop below $49.72
Swing trade playground:  $49.72 – $61.55 = 24%
Playground risk reward:  11:1 + depending on | entry | exit | stop

DATASPY:  T-Line ™ chart is cracking
7:00 am:  Friday, the SPY closed below the $207.00 support line. After drawing a few lines and utilizing my Fibonacci tool, it looks like the $203.65 area is trying to lure price into the trap. If the SPY falls prey to the sellers and $203.65, and if the buyers can’t find a reason to be bullish, I suspect $200.00 to $199.75 will see some action.
The transport have slipped below the 34-ema.  Will the 50-sma be support?  The Semiconductor ETF (SMH) has lost its mojo (we have warned of this the last few weeks) and is now looking like $50.80 down to about $49.55 could see some action. The Q’s will likely test the March breakout of February 1, 2016.

All in all, the market is not acting like bullish traders would want it to. Caution not to force the long trades, as there will be many long trades to trade. Just use caution and check your playbook on how to trade in this type of market.  Hit and Run Candlesticks will be adding a few short trades to our game.
Continue Reading

Swing Trade Ideas April 29, 2016 Trading room password change this weekend

Rick’s Featured Trade Ideas

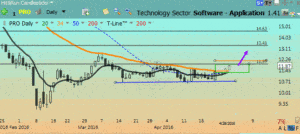
PRO/Long (Shipping Ports) | RBB | J-Hook Breakout |T-Line™ Run |
SB| Plan your trade & trade your plan | April 29, 2016
Possible entry plan idea:   Buy box $11.97- $11.33
Possible stop plan idea:   Protective stop below $11.97
Swing trade playground:  $11.97 – $13.41 = 50%
Playground risk reward:  5:1 + depending on | entry | exit | stop

PROSPY:  2ema Leading T-Line™ Down
7:00 am:  We’ve been talking about $207.00 being support for some time now. Yesterday, price hit a low of $206.96 bouncing back up closing at $207.45.  Timing is a very important element in swing trading with the SPY under the T-Line™ and flirting with the $207.00 area.  Long trades, which I think are plenty, just need to be watched a little carefully.  Maybe a little quicker on taking profits and the targets a little closer.  If the SPY slips below are $207.00, the next support area is $203.65.  Overall, it looks like the SPY is headed to the 23.6% retracement line, which is the $203.65 area.  Not being able to regain $207.00+ is what I would be concerned about. The transports don’t look like they’re going to be much help as they are looking like they might want to see $140.00.  SMH may also be a drag on the market; their path is looking like $52.60. The QQQ’s have been damaged by Apple, and their bags are packed, and it looks like they’re headed to $103.85.
Continue Reading

Swing Trade Ideas April 28, 2016 TV2020 Workshop tonight 8pm Eastern

Rick’s Featured Trade Ideas

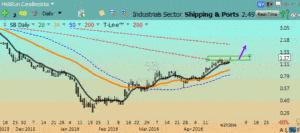
SB/Long (Shipping Ports) | RBB | J-Hook Breakout |T-Line™ Run |

SB| Plan your trade & trade your plan | April 28, 2016
Possible entry plan idea:   Buy box $1.25- $1.41
Possible stop plan idea:   Protective stop below $1.25
Swing trade playground:  $1.25 – $1.90 = 50%
Playground risk reward:  8:1 + depending on | entry | exit | stop

SBSPY:  Trending Bullishly
7:00 am:  The SPY chart is suggesting a slow grind to the top, after a boring day yesterday waiting for the feds the SPY finally opened up closing above the T-Line™ and above the previous day’s Doji creating a little Bullish Engulf.

Premarket I see the futures are down which is pushing  the SPY back below the T-Line™ remember the $207.00 area is extremely important for the Bulls to defend, simply put if the Bulls aren’t defending the $207.00 line the bears are attacking the $207.00 line.

Apple dropping yesterday is not helping the market at all today and the dysfunctional market in Asia seem to be holding the US back as well.
A big day for earnings-  (F) Ford beat and now breaking above the 200-sma, I heard on CNBC that 3/4 of the stocks that have reported so far beat on earnings. Over time this should act a positive for the market assuming the trend continues and of course if non-US markets can pull it together. The China Spider ETF (GTC) is having trouble with the 200-sma
Continue Reading

Swing Trade Ideas April 27, 2016 TV Workshop Thursday April 28 | 8pm Eastern

Rick’s Featured Trade Ideas

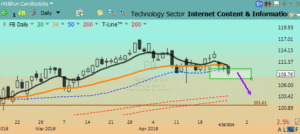
FB/Short (Internet Content) | RBB Top| Dark Cloud Cover |Lower Highs |

FB| Plan your trade & trade your plan | April 27, 2016
Possible entry plan idea:   Short box $109.95- $107.55
Possible stop plan idea:   Protective stop above $109.95
Swing trade playground:  $109.95 – $101.35 = 7.5%
Playground risk reward:  5:1 + depending on | entry | exit | stop

FBSPY:  Trending Bullishly – Cation today could be crazy
7:00 am:  I suspect that all the talk today will be about AAPL even more so than the FED, and I suspect if the Fed disappoints like Apple did, this market may be on a crazy roller coaster ride.  Until the ride starts, let’s keep focused on the chart and what it’s up to.  Yesterday, the SPY closed up $.31 with a Doji on the bullish side of the T-Line™.  I’ve talked about the $207.00 area quite a bit over the last few days and how important it is for the Bulls to defend.  The $207.00 area remains very important because it represents a major support area.  If price runs below $207.00, then $203.50 then $201.50 become targets. A bullish rally from there could set us up for a bearish head and shoulders pattern. I can already see that volume in the market has been weakening just by putting a 50-day moving average on the volume bars.  Yesterday I was talking with one of the Hit-And-Run Candlestick members, and they pointed out to me that the money flow index on the SPY has weakened as well as TSV; these are all hints and clues of how the market may react in the future.  On the other hand, On Balance Volume remains bullish.

Always keep your eyes on price and chart patterns, because in my opinion, they are the best predictors of what the market is thinking.  Always be aware of support and resistance, and ask yourself what happens if price falls through one support area.  It’s not complicated; it simply means that the next area of support is the target.

Continue Reading

Swing Trade Ideas April, 26 2016 Alaska Trading Cruise | 7-days of Training

Rick’s Featured Trade Ideas

Alaska Trading Cruise July 9, 2017 | Learn More

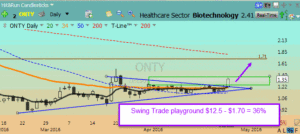
ONTY/Long (Biotechnology) | RBB patter| Channel breakout | Weekly doji breakout |

ONTY| Plan your trade & trade your plan | April 26, 2016
Possible entry plan idea:   Buy box $1.25- $1.38
Possible stop plan idea:   Protective stop below $1.25
Swing trade playground:  $1.25 – $1.70 = 36.8%
Playground risk reward:  7:1 + depending on | entry | exit | stop

ONTYSPY:  Trending Bullishly
7:00 am:  In a surprise end of the day push, the SPY closed back above the T-Line™ with a three-day low and all five days respecting the Bullish Engulf that was printed on April 18.  The low of yesterday’s hammer came within pennies of support and may be the clue that the bulls are ready to take another bite out of the bears and possibly form a bullish J-Hook continuation pattern.  For the bullish J-Hook continuation pattern to be formed, the bulls need to swing price above the recent high of $210.92.  If the bullish J-Hook continuation pattern is formed over the next few days, it would be the fifth time the Bulls have constructed this pattern since March 1.  Providing Janet Yellin and the feds choose their words carefully — or even better yet get out of the way — then I suspect the SPY is on a mission to test the $213.78 high of May 5, 2015.  I’ll be watching for pullbacks and consolidation clues around  $211.00  |  $211.50   |  $212.85.

I wrote about $207.00 needing to hold a few days ago, and as of today, it still remains the number the bulls must defend while reaching for new highs.
Continue Reading

Swing Trade Ideas April 25, 2016 TV 20/20 Workshop April 28, 2016

Rick’s Featured Trade Ideas

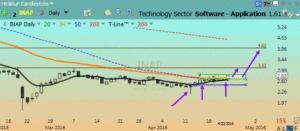
INAP/Long Software) Hammer on support | RBB patter| RBB Pattern | Rising T-Line™ | Flag

INAP| Plan your trade & trade your plan | April 25, 2016
Possible entry plan idea:   Buy box $2.70- $2.86
Possible stop plan idea:   Protective stop below $2.70
Swing trade #1 playground:  $2.70 – $4.00
Playground risk reward:  17:1 + depending on | entry | exit | stop
INAPSPY:  Price > T-Line™
7:00 am:  In Friday’s note we wrote that we would likely see a lower low because of the bearish evening star, and we saw approximately .74 lower low.  The Bulls did close back up over the T-Line™ but two cents below our Warning #1 line.  On a bullish note, the pullback last week was minor because it has stayed above the 38.2% retracement, and the $207 support line is still intact.  As of Friday’s close and what we can see of today’s open,  the bullish trend is still intact, and as long as the Bulls can keep the trend, they will continue to march forward slowly.
One of my major market indicators (URI) is painting a bullish cup and handle breaking out above the 200 SMA on Thursday’s and Friday’s price action. Another is FDX and it is also holding a bullish line and continues to fly right.  The same is true for COPX, the copper minors’ ETF,  which broke out of the 200-SMA a couple of weeks ago and is now working to clear another downward trend line.  These Bulls do seem determined. Even IYT closed Friday with a Bullish Engulf above the T-Line™.

IWM:  Daily chart |T-Line™ | Bullish Engulf
SMH:  Daily chart |Below the T-Line™
IYT:  Daily chart | Bullish Engulf above the T-Line™
S&P VIX Short-Term Futures VXX:  Daily chart | No fear
USO Unites States Oil Fund:  Daily chart | Bullish trend still in play | Doji yesterday

Each day 10 -15 stocks are posted in the members area that I believe are poised to move 10-20% (or more) within the next few days. Please follow your trading rules for entry stops and profits. Remember to check for earnings!
Keep your eye on the inverse ETF’s They trade well!
Members Only
Investing and Trading involves significant financial risk and is not suitable for everyone. No communication or chat sessions should be considered as financial or trading advice. All information is intended for Educational Purposes Only.
To see all of today’s trade ideas Click Here

2-sma > T-Line™ = Minor trend up
T-Line™ > 34-ema = Intermediate trend up
2-sma < T-Line™  = Minor trend down
T-Line™ < 34-ema = Intermediate trend down

Click Here  for members login | Trade Ideas & House trade list
Bullish Above Bearish Below
27.95
15.15 14.50
No trade
62.88 58.80
105.50
112.89 110.26
94.26
194.10 190.10
254.40
6.18.20 631.30
87.50
No trade

VXX S&P 500 VIX Short Term Futures:  A close above the T-Line ™ implies the bullish short-term swing traders are in control.  A close below the T-Line ™ implies the bearish short-term swing traders are in control. 

Energy Sector: XLE, SX90, ERX, USO  A close above the T-Line ™  implies the bullish short-term swing traders are in control. A close below the T-Line ™ implies the bearish short-term swing traders are in control. 

SMH: A close above the  T-Line ™ implies the above short-term swing traders are in control. A close below the T-Line ™ implies the bearish short-term swing traders are in control. 

IYT: A close above the  T-Line ™ implies the above short-term bullish swing traders are in control. A close below the T-Line ™ implies the bearish short-term swing traders are in control. 

US Dollar Index: UUP, DXYO A close above the  T-Line ™  implies the bullish short-term swing traders are in control. A close below the T-Line ™ implies the bearish short-term swing traders are in control.  Learn more about the T-Line – Click Here

The information in this email and Blog Post are notes to myself and should NOT be construed as financial or trading advice.

Investing and Trading involves significant financial risk. No communication should be construed as financial or trading advice. All information provided is for Educational Purposes Only.

Investing and Trading involves significant financial risk and is not suitable for everyone. No communication or chat sessions should be considered as financial or trading advice. All information is intended for Educational Purposes Only.

http://hitandruncandlesticks.com Trading for Profit is not an investment advisory service, nor a registered investment advisor or broker-dealer and does not tell or suggest which securities or currencies customers or subscriber should buy or sell. The analysts and employees or affiliates of Company may hold positions in the stocks, currencies or industries discussed here.
Swing Trade Ideas April 22, 2016 Looking for a trading room?

Rick’s Featured Trade Ideas

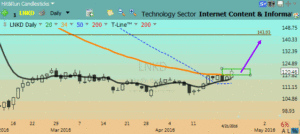
LKND/Long (Internet Content) Rising T-Line™ | Bullish Flag | RBB Pattern | DBL Bottom | Scoop Pattern

LKND| Plan your trade & trade your plan | April 22, 2016
Possible entry plan idea:   Buy box $118.00- $122.00
Possible stop plan idea:   Protective stop below $118.02
Swing trade #1 playground:  $118.00 – $143.90
Playground risk reward:  13:1 + depending on | entry | exit | stop

LNKDSPY:  Short Term Signaling a Warning
7:00 am:  Yesterday closed with a BEARISH EVENING STAR which suggests a lower open today (this was discussed in the trading room before the bell yesterday afternoon). In yesterday’s morning blog post, we mentioned that a close below $208.99 would be Warning #1.  Yesterday the SPY closed at $208.97– Warning #1.  We also wrote if a close below $207.00 followed, that would be Warning #2.
With poor earnings from a few big names yesterday, we are likely to see and feel a little disturbance in the force this morning, and it may or may not carry over to the close.

The BEARISH EVENING STAR signal from yesterday is another warning sign.  Overall, the trend is still bullish and the support area still looks good; it’s the short term that’s iffy.  If the bulls take another run at the highs, we will know by the clues from price action – Candlesticks.

Continue Reading

Swing Trade Ideas April 21, 2016


LPLA


Rick’s Featured Trade Ideas

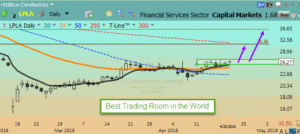
LPLA/Long (Financial) Rising T-Line™ | Bullish Flag | 3-day Morning Star

LPLA| Plan your trade & trade your plan | April 21, 2016
Possible entry plan idea:   Buy box $25.42- $26.88
Possible stop idea:   Protective stop below $25.42
Swing trade playground:  $25.50 – $36.70
Playground risk reward:  13:1 + depending on | entry | exit | stop

SPY:  Price vs T-Line™ Bulls in charge
7:00 am:  Yesterday the SPY managed to eek out a gain of .10% closing with its second Doji.  With two days of doji indecision, it would appear the market is having a tough time figuring out the best direction for price.  The chart continues to suggest bullishness with price leading the T-Line™ and the T-Line™ is still leading up.  BUT be warned  a close below $208.99 would be a warning, and a close below $207.00 would be a stronger warning.
Continue Reading

Swing Trade Ideas April 20, 2016

Rick’s Featured Trade Ideas

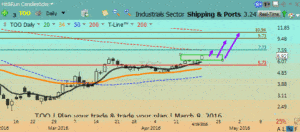
TOO/Long (Shipping) Rising T-Line™ | Bullish Engulf | PBO | Flag breakout | J-Hook continuation pattern


TOO| Plan your trade & trade your plan | April 20, 2016
Possible entry plan idea:   Buy box $6.30- $7.05
Possible stop plan idea:   Protective stop below $6.30
Swing trade playground:  $5.73 – $11.00
Playground risk reward:  11:1 + depending on | entry | exit | stop

TOO

SPY:  Price vs T-Line™ Bulls in charge
7:00 am:  The bullish trend continued yesterday with the SPY closing up .32% with a doji candlestick.  The T-Line™ continues to rise as well as all three of the main moving averages we use, that we call the big three.  There’s no question the market has had a big run and is probably in need of a little profit taking.  There’s also no question that we are high and tight up against resistance.  Remember that it’s price that decides whether we go up or down, and right now price is feeling like it wants to Continue Reading

Swing Trade Ideas April 19, 2016 E-Learning tonight with Cindy Faber | Think or Swim

Rick’s Featured Trade Ideas

CMRX/Long (Healthcare) Rising T-Line™ | RBB Pattern | Flag breakout

CMRX| Plan your trade & trade your plan | April 19, 2016
Possible entry plan idea:   Buy box $5.68- $6.40
Possible stop plan idea:   Protective stop below $5.68
Swing trade playground:  $7.60 – $9.55 – $13.65
Risk Reward 10:1 + depending on | entry | exit | stop

SPY:  Price vs T-Line™ Bulls in charge
7:00 am:  Yesterday was another strong day for the Bulls with price pulling back to support and the T-Line™, closing above previous price action following through with a Bullish Engulf enhancing the J-Hook continuation pattern. Price closed yesterday on the SPY at $210.09 and I suspect the Bulls will try to reach for the $210.00 area.  Bullish success at $210.00 might create enough energy to reach new highs, but, of course, we should always follow the chart and take our hints and clues from the Continue Reading