Eleven Trade Ideas
At 9:10 AM ET. We will talk about the technical properties of 11 trade ideas with target zones, logical entries, and a protective stop. The HRC Live Trading Room is the best place to learn the trading technics of the membership and the HRC coaches.
► Must Read Trade Update (OSTK)
 On January 4, we shared, in detail, the technical chart properties of OSTK in the Trading Room and why we thought this chart was set up for a trade. OSTK now plus 8.8% or $625.00 with 100 shares. Using simple rules and techniques to achieve swing trade profits. Learning to master the market does take a little work and dedication to success and when the dots connect you will look at life in a whole new way.
Learn our top 16 trading tools: The T-Line • T-Line Bands • Chart Patterns • Support • Resistance • Patterns • Buy Box • Volatility Stops • Price Action • Candlesticks • Profit Zones • Entry Zones • Protective Stops • RBB Pattern • Pop Out of The Box Pattern • Scanning for Success
[button_2 color=”light-green” align=”center” href=”https://ob124.infusionsoft.com/app/orderForms/Membership—Hit-and-Run-Candlesticks—Quarterly” new_window=”Y”]Subscribe for 3-Months • Learn our 16 Tools For Success • Cancel Anytime[/button_2]
► Eyes On The Market (Happy Friday)
And the bulls keep on going and going and going. Another positive day in the market and the trend continues to rise. The SPY is now a bit too far above the upper T-Line Band and likely to contract a little very soon.
The three T-Lines are moving averages that we use for a moving trend of Candlesticks (price action).
The VXX short-term futures bounced a little yesterday, but until price moves above the T-Line Bands, it’s just noise.
Rick’s Swing Trade ideas – MEMBERS remember to log into the members’ blog for the trade ideas
30-Day Trial • Monthly • Quarterly • Semi-Annual • Annual
Learn how and what we trade: The T-Line • T-Line Bands • Chart Patterns • Support • Resistance • Patterns • Buy Box • Volatility Stops • Price Action • Candlesticks • Profit Zones • Entry Zones • Protective Stops • RBB Pattern • Pop Out of The Box Pattern
Investing and Trading involves significant financial risk and is not suitable for everyone. No communication from Hit and Run Candlesticks Inc. is financial or trading advice. All information is intended for Educational Purposes Only. Terms of Service.
Rick Saddler is not a licensed financial adviser nor does he offer trade recommendations or advice to anyone except for the trading desk of Hit and Run Candlesticks Inc.
*************************************************************************************
Bullish Engulf | POOTB
Hit and Run Candlesticks Members ► Log into the Members Blog for complete blog post with trade ideas | Log In
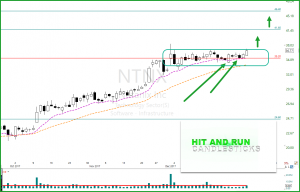 NTNX – The buyers of NTNX created a Bullish Engulf on December 26 after a bullish run and a pullback. The Bullish Engulf followed by a (POOTB) Pop Out of The Box Pattern. The T-Line family has continued to trend higher proving the strength of the price action and commitment by the buyers. Several profit zones are available with a continued bullish trend.
At 9:10 AM ET. We will talk about the technical properties of NTNX with target zones, a couple of logical entries and a protective stop. We will also be showing our trade plan with risk/reward and expected profits.
► Must Read Trade Update (INSY)
On December 14, we shared, in detail, the technical chart properties of INSY in the Trading Room why we thought this chart was ready for a run. Yesterday the profits were about 113% or $710.00. Using simple rules and techniques to achieve swing trade profits. A traders lifestyle is worth the work.
Learn how and what we trade: The T-Line • T-Line Bands • Chart Patterns • Support • Resistance • Patterns • Buy Box • Volatility Stops • Price Action • Candlesticks • Profit Zones • Entry Zones • Protective Stops • RBB Pattern • Pop Out of The Box Pattern
[button_2 color=”light-green” align=”center” href=”https://hitandruncandlesticks.com/hrc-rwo-30-day-offer/” new_window=”Y”]30-Day Trial • Cancel Anytime • No Auto Billing[/button_2]
► Eyes On The Market
Thr Bulls have worked that charts very well the first two trading days of 2018, and I suspect today will be the same. We may all get to ware our 25K tee-shirt for the DOW reaching a milestone after today. So let’s all think positive. The SPY (ETF for the S&P-500) has been lightly bouncing off the T-Line Low reaching and holding on to higher highs. The Lower T-Line is a moving average that we use for a moving trend line of the Candlesticks (price action lows).
The VXX short-term futures hit a new low yesterday after trying to climb over the Lower T-Line only to fail.
Rick’s Swing Trade ideas – MEMBERS ONLY
30-Day Trial • Monthly • Quarterly • Semi-Annual • Annual
Learn how and what we trade: The T-Line • T-Line Bands • Chart Patterns • Support • Resistance • Patterns • Buy Box • Volatility Stops • Price Action • Candlesticks • Profit Zones • Entry Zones • Protective Stops • RBB Pattern • Pop Out of The Box Pattern
Investing and Trading involves significant financial risk and is not suitable for everyone. No communication from Hit and Run Candlesticks Inc. is financial or trading advice. All information is intended for Educational Purposes Only. Terms of Service.
Rick Saddler is not a licensed financial adviser nor does he offer trade recommendations or advice to anyone except for the trading desk of Hit and Run Candlesticks Inc.
*************************************************************************************
FRTA – Ascending Triangle Breakout
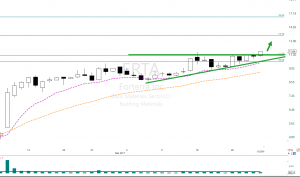 FRTA has been trending and now has broken out of a Bullish Ascending Triangle. After the November 8 Bullish breakout FRTA has produced a rising trend. The past 15 days or so the price action has drawn an Ascending Triangle pattern. FRTA has a great deal of profit potential if you look at the $20.00 profit zone and the profit zones along the way
At 9:10 AM ET. We will talk about the technical properties of FRTA with target zones, a couple of logical entries and a protective stop. We will also be showing our trade plan with risk/reward and expected profits.
► Must Read Trade Update (SGRY)
On December 12, we shared in detail, the chart setup of SGRY in the Trading Room, Yesterday the profits were about 36.92% or $360.00 with 100 shares. Using simple rules and techniques to achieve swing trade profits. A traders lifestyle is worth the work.
Learn how and what we trade: The T-Line • T-Line Bands • Chart Patterns • Support • Resistance • Patterns • Buy Box • Volatility Stops • Price Action • Candlesticks • Profit Zones • Entry Zones • Protective Stops • RBB Pattern • Pop Out of The Box Pattern
► Eyes On The Market
Welcome to 2018, what a great day yesterday was. Seems like the market it is playing with a full team! The SPY is still under the control of the T-Line trend (above all 3). Yesterday the SPY closed up $1.01 with a small breakout poised to follow through with a J-Hook continuation pattern.
The DJ-30 closed yesterday with a Doji, bullish chart pattern above the T-Line, come 25K you can do it!
The VXX short-term futures lost all interest yesterday in playing the game!
Rick’s Swing Trade ideas – MEMBERS ONLY
30-Day Trial • Monthly • Quarterly • Semi-Annual • Annual
Investing and Trading involves significant financial risk and is not suitable for everyone. No communication from Hit and Run Candlesticks Inc. is financial or trading advice. All information is intended for Educational Purposes Only. Terms of Service.
Rick Saddler is not a licensed financial adviser nor does he offer trade recommendations or advice to anyone except for the trading desk of Hit and Run Candlesticks Inc.
*************************************************************************************
NMM Bullish Morning Star Presented
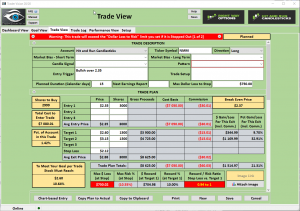 NMM – Last Friday NMM presented us with a Bullish Morning Star with multiple signs of support and the Lower T-Line Band. Note how the Star came off the Lower Band and Fridays price action closed over the Upper T-Line Band. The 4 and five days charts fit the (RBB) strategy profile with two profit zones before the Dotted Deuce and two before the 200-period moving average.
At 9:10 AM ET. We will talk about the technical properties of NMM with target zones, a couple of logical entries and a protective stop. We will also be showing our trade plan with risk/reward and expected profits.
► Must Read Trade Update (CVRR)
On November 8, we shared, and in detail, the technical properties of CVRR in the Trading Room, Friday the profits were about 27.8% or $360.00. Using simple rules and techniques to achieve swing trade profits. A traders lifestyle is worth the work.
► Eyes On The Market
Last weeks price action wasn’t much to brag about although the buyers were able to keep the sellers away for the most part. The Daily price bar closed as a Bearish Engulf, but we did close on support, so the battle begins. If the sellers can close below $266.30, the mid-December low may be in for a test. A push by the buyers with a close over $268.60 and the Bulls are on there way to challenge the $272.00 area
The VXX short-term futures started a dance last week so they need to be watched a little closer than normal. The past 9-day pattern is a bottoming channel with a Bullish engulf. The pattern needs to follow through so we will keep our eye on it.
Rick’s Swing Trade ideas – MEMBERS ONLY
30-Day Trial • Monthly • Quarterly • Semi-Annual • Annual
Learn how and what we trade: The T-Line • T-Line Bands • Chart Patterns • Support • Resistance • Patterns • Buy Box • Volatility Stops • Price Action • Candlesticks • Profit Zones • Entry Zones • Protective Stops
Investing and Trading involves significant financial risk and is not suitable for everyone. No communication from Hit and Run Candlesticks Inc. is financial or trading advice. All information is intended for Educational Purposes Only. Terms of Service.
Rick Saddler is not a licensed financial adviser nor does he offer trade recommendations or advice to anyone except for the trading desk of Hit and Run Candlesticks Inc.
*************************************************************************************
DJ-30 + 160.77 = 25K
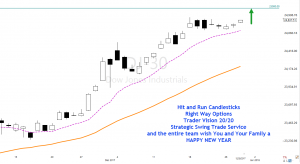 Will the DJ-30 it to 25K this year? The chart is a position to make the run. Over the past few days, the price action has been building a J-Hook continuation pattern, at this point the bull team needs to push over the recent high of $24876.07 and the hope for a gust of wind to carry the industrial bird to the altitude of 25K
At 9:10 AM ET. We will talk about the technical properties of charts with target zones, logical entries, and protective stops.
► Eyes On The Market
We saw the market a nice lift going into the close yesterday from the SPY, look at the chart, and you can see how price action has been carving out a reversal bottom near the support of the V-Stop and the Lower T-Line Band. Those are two tools that winners use by the way. IWM and the DIA’s saw bullish interest into the close yesterday while the QQQ’s was just plain lazy. I truly wish the best for the DJ-30 finding the perfect landing spot on 25K
Rick’s Swing Trade ideas – MEMBERS ONLY
30-Day Trial • Monthly • Quarterly • Semi-Annual • Annual
Learn how and what we trade: The T-Line • T-Line Bands • Chart Patterns • Support • Resistance • Patterns • Buy Box • Volatility Stops • Price Action • Candlesticks • Profit Zones • Entry Zones • Protective Stops
Investing and Trading involves significant financial risk and is not suitable for everyone. No communication from Hit and Run Candlesticks Inc. is financial or trading advice. All information is intended for Educational Purposes Only. Terms of Service.
Rick Saddler is not a licensed financial adviser nor does he offer trade recommendations or advice to anyone except for the trading desk of Hit and Run Candlesticks Inc.
*************************************************************************************
Geeze This Market Is Slow
 Geeze this market is slow. For the next two days (Thursday/Friday) we will not be offering any trade ideas or trading picks on our blog, the market is just to darn slow and dead. If something changes, we will change. The trading room will be open, and we will discuss possible trades as we see them. There is simply a time to trade and times to sit back and enjoy. We hope this year has been good to you and that your trading and education goals have been met. If you feel like sharing your trading and educational goals, please email us @ https://hitandruncandlesticks.com/contact/ we will do our very best to help, use subject line “GOALS”
At 9:10 AM ET. We will talk about the technical properties of charts with target zones, logical entries, and protective stops.
► Eyes On The Market
The overall market has been horrible slow this week, and the next 2-days will likely be the same. We have had a few great discussions in the trading room. As of the close yesterday the bulls are holding there support with only a few minor signs of cracks, nothing I am going to worry about right now. We feel the best way to handle this market right now is to “Do Nothing” enjoy the family and the holiday time. Forcing trades never work out in the end.
Rick’s Swing Trade ideas – MEMBERS ONLY
30-Day Trial • Monthly • Quarterly • Semi-Annual • Annual
Learn how and what we trade: The T-Line • T-Line Bands • Chart Patterns • Support • Resistance • Patterns • Buy Box • Volatility Stops • Price Action • Candlesticks • Profit Zones • Entry Zones • Protective Stops
Investing and Trading involves significant financial risk and is not suitable for everyone. No communication from Hit and Run Candlesticks Inc. is financial or trading advice. All information is intended for Educational Purposes Only. Terms of Service.
Rick Saddler is not a licensed financial adviser nor does he offer trade recommendations or advice to anyone except for the trading desk of Hit and Run Candlesticks Inc.
*************************************************************************************
Ascending Triangle Breakout – BAS
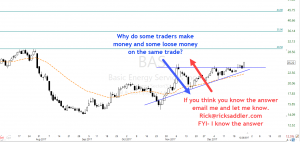 BAS – Broke out of an ascending triangle yesterday after a gap five days ago. With a series of higher lows and capped tops, BAS gapped on 12/20 above the Upper T-Line. The following three days held support, and yesterday more buyers stepped in. There are three important areas, and I will be talking about them in the Pre-market education series. Why do some traders make money and some loose money on the same trade? Something to ponder, ask for the answer if you like.
At 9:10 AM ET. We will talk about the technical properties of TAHO with target zones, a couple of logical entries and a protective stop. We will also be showing our trade plan with risk/reward and expected profits.
►Subscribing Members login: for the Trader Vision Trade Plan
► Eyes On The Market
Boring, boring, boring is all I can say about this market. The bulls still hold the chips as of yesterdays close
Rick’s Swing Trade ideas – MEMBERS ONLY
30-Day Trial • Monthly • Quarterly • Semi-Annual • Annual
Learn how and what we trade: The T-Line • T-Line Bands • Chart Patterns • Support • Resistance • Patterns • Buy Box • Volatility Stops • Price Action • Candlesticks • Profit Zones • Entry Zones • Protective Stops
Investing and Trading involves significant financial risk and is not suitable for everyone. No communication from Hit and Run Candlesticks Inc. is financial or trading advice. All information is intended for Educational Purposes Only. Terms of Service.
Rick Saddler is not a licensed financial adviser nor does he offer trade recommendations or advice to anyone except for the trading desk of Hit and Run Candlesticks Inc.
*************************************************************************************
Morning Star Flag Breakout – TAHO
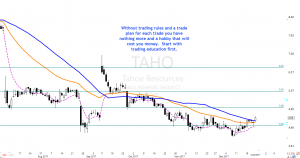 TAHO – Is working on a Morning Star Flag Breakout Has flagged above the 50d-SMA after a new low and a Bullish Morning Star kicked off a 10% plus run. We will be using our (RBB) Rounded Bottom Breakout Strategy to trade TAHO. Trade wise and trade with rules.
At 9:10 AM ET. We will talk about the technical properties of TAHO with target zones, a couple of logical entries and a protective stop. We will also be showing our trade plan with risk/reward and expected profits.
►Subscribing Members login: for the Trader Vision Trade Plan
► Eyes On The Market
Giving last week was Holiday slow and this week is likely to be the same we should expect the overall market to see weakness and a short burst of energy. Looking at the SPY, the bulls are still in charge and should remain in charge as long as they can hold above the $264.00 line. I expect the current week to be slow and weak.
Rick’s Swing Trade ideas – MEMBERS ONLY
30-Day Trial • Monthly • Quarterly • Semi-Annual • Annual
Learn how and what we trade: The T-Line • T-Line Bands • Chart Patterns • Support • Resistance • Patterns • Buy Box • Volatility Stops • Price Action • Candlesticks • Profit Zones • Entry Zones • Protective Stops
Investing and Trading involves significant financial risk and is not suitable for everyone. No communication from Hit and Run Candlesticks Inc. is financial or trading advice. All information is intended for Educational Purposes Only. Terms of Service.
Rick Saddler is not a licensed financial adviser nor does he offer trade recommendations or advice to anyone except for the trading desk of Hit and Run Candlesticks Inc.
*************************************************************************************
 On January 4, we shared, in detail, the technical chart properties of OSTK in the Trading Room and why we thought this chart was set up for a trade. OSTK now plus 8.8% or $625.00 with 100 shares. Using simple rules and techniques to achieve swing trade profits. Learning to master the market does take a little work and dedication to success and when the dots connect you will look at life in a whole new way.


