Rick’s Featured Trade Ideas
Today’s featured trade idea and my personal trade plan
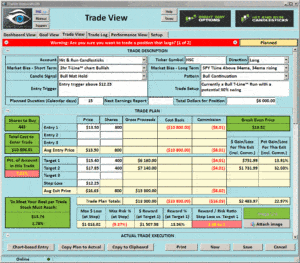
HSC Long | Bullish “W” Pattern | Bull Mat Hold | Continuation pattern
Double click the trade plan to enlarge.
This not a recommendation to buy. I am simply sharing a trade I am considering.
 Good Morning, Profit Traders,
From a bull’s eye: Yesterday the SPY printed a Doji supported by our $220.50 line, keeping the T-Line™ Run intact.
IWM not as productive as the SPY was. IWM printed a weak Doji with sellers pushing the buyers to the bottom of the candle, T-Line™ Run still working. 60-min IWM chart closed below the T-Line™ lower band suggesting short-term weakness.
Members Daily Trade Ideas. Be aware of sudden market changes!
This list is reserved for subscribed members
Continue Reading
Good Morning Traders.
At the close yesterday, it sure looked like the market would be selling this morning but the bulls refuse to give up this bull rally at least at the moment. As I write this the Dow and the S&P futures at pointing to new record high opens. One reason for the sentiment change is that OPEC is planning a production cut and the other seems to be appointments made by Trump getting a market approval of his selections.
We have a bunch of economic numbers today as well as several Fed speakers so there are plenty of ways the early bullishness could be toppled so keep an eye on the headlines for clues of a possible shift.
Currently, the RWO holdings seem to be well positioned to benefit from the market bullishness so make sure you have your profit orders in place just in case the morning pop reached out and grabs them. Have an awesome trading day!
Trade Wisely,
Doug
Click Here to Watch the Morning Video
Good Morning Friends.
Yesterday we finally saw a little profit taking take place which was way overdue in my humble opinion. Now the question on everyone’s mind is how long will it last and when should we start buying? I wish it was in my ability to tell you the exact date and time but as always the best we can do is wait for the price action on the chart to tell us. Until then relax, watch and avoid the temptation of predicting.
There are clearly so many bullish charts setting up right now if we will have the privilege of being very picky. There is no need to feel pressured or rushed the trades will come to us if we just let them.
This morning we will get a reading on GDP at 8:30 eastern time. The market has a tendency of reacting to this number so keep an eye on the pre-market futures. As I write this they are pointing to a slightly bullish open but that can quickly change depending on the market’s reaction to the number. We will also hear some Fed speak this morning so anything is possible when they begin to pontificate on rates.
My personal bias based on the close of yesterday is for more profit taking to take place but we all know the market could care less about what I expect or want. Have a fantastic day.
Trade Wisely,
Doug
Click Here to Watch the Morning Video
Rick’s Featured Trade Ideas
Today’s featured trade idea and my personal trade plan
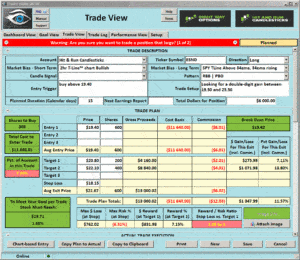
ESND Long | Inverted Head & Shoulder | RBB | Continuation pattern
Double click the trade plan to enlarge.
This not a recommendation to buy. I am simply sharing a trade I am considering.
 Good Morning, Profit Traders,
From a bull’s eye: Is the market tired and in need of a rest? IWM ended the day with an Evening Star Signal which suggests well-deserved profits are being peeled off.
Yesterday early on I mentioned to the trading room I would be keeping my eye on the hourly chart and you can see the channel tightening at the top and the sellers attack the lower support line with success.
The daily Evening Star Signal on the IWM chart suggest a lower low today, in the very near future, we could see a test of $130.90.
Follow Hit and Run Candlesticks for your updates.
Members Daily Trade Ideas. Be aware of sudden market changes!
This list is reserved for subscribed members
Continue Reading
Rick’s Featured Trade Ideas
Today’s featured trade idea and my personal trade plan
ESND Long | Inverted Head & Shoulder | RBB | Continuation pattern
Double click the trade plan to enlarge.
This not a recommendation to buy. I am simply sharing a trade I am considering.
 Good Morning, Profit Traders,
From a bull’s eye: Is the market tired and in need of a rest? IWM ended the day with an Evening Star Signal which suggests well-deserved profits are being peeled off.
Yesterday early on I mentioned to the trading room I would be keeping my eye on the hourly chart and you can see the channel tightening at the top and the sellers attack the lower support line with success.
The daily Evening Star Signal on the IWM chart suggest a lower low today, in the very near future, we could see a test of $130.90.
Follow Hit and Run Candlesticks for your updates.
Members Daily Trade Ideas. Be aware of sudden market changes!
This list is reserved for subscribed members
Continue Reading
Last Updated: November 28, 2016
You know what a doji looks like, right? And I bet you’re familiar with the Harami, another essential signal, as well. If you know those two basic signals, spotting and understanding a Harami Cross candlestick pattern should be a cinch. This signal resembles the classic Harami, except the very small second candle of the Harami is replaced by a simple doji that resembles a cross sign. Depending on the price movement and the current trend, the Harami Cross can be bullish or bearish. However, no matter what its color and no matter what its trend, do not risk ignoring this pivotal pattern.
Continue Reading
Good Morning Friends and Happy Monday.
It would appear that the market has a bit of an attitude this morning suggesting a gap lower or about 60 points. This seems to mostly be due to falling oil prices with the news that the OPEC is having trouble finalizing it’s production agreements. A pullback in certainly in order due to the huge run up after the election. A healthy pullback would most likely set up some very good trade entries so bring it on I say.
There is nothing on the economic calendar but let’s not forget today is Cyber Monday and we could easily see light volumes as shoppers seek to bag the big discounted items for Christmas.
There are a lot of really nice looking charts out there so we will plenty to choose from as we work our way through December and into 2017.
Trade Wisely,
Doug
Click Here to Watch the Morning Video
Rick’s Featured Trade Ideas
Today’s featured trade idea and my personal trade plan
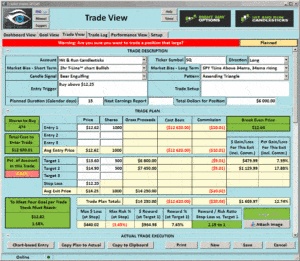
SQ Long | 3-day Cup & Handle | Ascending Triangle | PBO-Bullish Engulf
Double click the trade plan to enlarge.
This not a recommendation to buy. I am simply sharing a trade I am considering.
 Good Morning, Profit Traders,
From a bull’s eye: (SPY) Price continues to trade and close above the High T-Line™ Band. Until the High band is violated we will keep riding the bull.
No trader is denying the bulls are in total control and no trader is denying the market is very overbought. Being overbought is not a reason to close longs and run to shorts but it is a condition that we should be aware of.
I see support on the SPY daily chart near $218.85 and that is very near the 23.6 Fib retracement. On the 1 hour chart, I see support near $220.50
Members Daily Trade Ideas. Be aware of sudden market changes!
This list is reserved for subscribed members
Continue Reading


