Understanding The Option Greeks
If you want to be a consistently successful options trader then understanding the Option Greeks is essential. Trading options without the Greeks would be like driving an 18 wheel semi truck or piloting an aircraft with no instruments! That’s not a ride I would knowingly take because the risk is just too high. It’s true, The Greeks can be a bit confusing at first, but with a little study, they become the instruments to navigate, options trades properly.
History Of The Option Greeks
In 1973 to mathematicians, Fischer Black and Myron Sholes published a paper titled “The Pricing of Options and Corporate Liabilities.” From that paper, the so named, “Black-Scholes Pricing Model” was born. The idea behind the model was to eliminate risk by using mathematically correct hedging strategies.
The men won the 1997 Nobel Price for their groundbreaking work in mathematics although the model had some well-known problems. Many modifications and variations of the Black-Sholes formula for derivative pricing exist today. However, the original model remains the most widely accepted.
The Greeks and Option Pricing
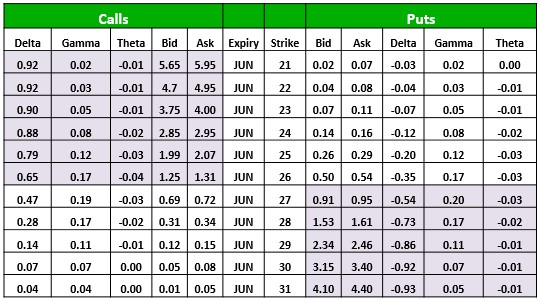
When it comes pricing option contacts, the movement of the underlying equity is only part of the equation. In fact, the Greeks; Delta, Gamma, Theta, Vega, and Rho are all part of the pricing model inputs. After running the equation, the option contract is displayed for us in an Options Chain. As we delve deeper into the details of each Option Greek, please refer to the option chain provided below.
Defining The Greeks
Delta – is the Speed of Change but also often described as Percent Chance.
Gamma – represents the Acceleration of movement.
Theta – represents the pricing effect of the passage of time (Time Decay).
Vega – is the pricing effect of Volatility.
Rho – provides the pricing effect of Interest Rates.
Delta As Speed of Change
Delta – the amount and option price is expected to change based on $1 move of the underlying equity?
As stated above Delta has a duel meaning, Speed of Change and Percent Chance. The Speed of Change refers to the how fast an option price will move up or down based upon a $1.00 change in the underlying equity. Call options have positive Delta while Put options have negative Delta. If an underlying stock is trading exactly at $60 a share, then the At-The-Money 60 Strike Call option should have an approximate Delta value of +0.50. Conversely, the 60 Strike Put should have an estimated Delta value -0.50.
Let’s use an example from the Options Chain above to make this easier to understand. The 25 Strike Call is selling at $2.07 a share and a Delta of $0.79. If the underlying stock goes up by $1.00, and the 25 Strike option should improve in value by $0.79. Thus making it worth $2.86 per share. What if the stock goes down $1.00? Then Delta tells us we could expect the 25 Strike option to lose $0.79 and valued at $1.28 per share.
Call options have a Delta that can be between 0.0 and 1.00. At expiration, In-The-Money (ITM) calls options have a Delta of 1 and become stock while Out-Of-The-Money (OTM) call options expire with a Delta of 0 and become worthless. As expiration draws near the Delta of ITM options will move toward 1.00 making them more sensitive to the underlying’s price movement than longer dated options. Put Options have a Delta that is between 0.0 and -1.00. At expiration ITM put options have a Delta of -1 and become stock, while OTM put options expire with a Delta of 0 and become worthless.
Delta As Percent Chance
We can also think of Delta as Percent Chance. The 27 Strike Call option in the table above shows us that this ITM option has a Delta of 0.88. Based on how the options are currently trading the 27 Strike contract theoretically, has an 88 Percent Chance of remaining ITM by expiration. At the same time, the 27 Strike Put which is currently Out-Of-The-Money OTM and having a Delta of just -0.12 only has a 12 Percent Chance of being ITM by expiration, theoretically.
It is important to note, the prices represented are theoretical. Actual prices could differ based upon other factors such as a volatility increase (Vega).
Gamma
Gamma is the rate that Delta will change based on a $1 change in the underlying stock price.
If Delta is the “speed” at which option prices change, then you can think of Gamma as the Acceleration. It’s not uncommon to hear Gamma referred to as the Delta of Delta. A high Gamma value will make an option more responsive to changes in the price of the underlying stock. Conversely, a low Gamma value will make an option less responsive to changes in the underlying stock. In the option chain above you will see that Gamma values are the higher for options contracts At-The-Money (ATM). Gamma diminishes on deeper ITM contacts and those that fall further OTM.
As long the option holders forecast is correct, having a high Gamma value is a good thing because Delta will move toward 1.00 more rapidly. On the other hand, the expectation is incorrect; a higher Gamma value will lower your Delta quite quickly toward 0.0.
As an option seller, if your forecast is incorrect, high Gamma is your enemy and will cause a position to move against you with a higher acceleration.
Again using the 25 Strike option as and example; The call option has a Gamma of 0.12 which means Delta should increase to 0.91 if the underlying move up $1.00. If the stock moves down $1.00 then Delta should decrease 0.12 to a value of 0.67. Of course, the 25 Strike Put Delta value would decrease if the stock’s price improves but increase as the underlying declines.
Theta
Theta is the amount the price of calls and puts will decrease (at least in theory) for a one-day change in the time to expiration.
The one absolute truth about option contracts is that they all expire. Theta tells us at what rate per day we can expect an option contract to decay as time passes. Theta accelerates the rate at which an option decays as it nears expiration. Thus, Theta has a greater effect on short-dated options and less of an effect on longer dated options. Options with less than 30 days to expiration will experience a quickening of Theta’s decay rate as expiry approaches. Theta’s rate of decay will become nearly parabolic in the final 2 weeks of an options life.
A wise options trader must always consider Theta when planning a potential position. It is not only important to be correct in the forecast direction of a stock move but also the timing. As an option holder, Theta is a mortal enemy and ever present. Options writers, on the other hand, think if Theta as a friend, allowing the passage of time to work in their favor. Obviously, there is nothing we can do to stop time from passing but with some thoughtful planning, the effect of Theta can be minimized or even capitalized upon.
Using the options chain above the 25 Strike call has a Theta of 0.03, suggests (in theory) the option price would decline by 0.03 per day. Theta is an equal opportunity Greek affecting value of the 25 Strike Put contracts and decaying their value on a daily basis as well.

 One of the many issues I struggled with as a trader was chasing bullish price action. I had somehow picked up the notion that to be successful as a trader it was necessary always to catch the perfect entry. When I would see even the hint of bullish price action, I would leap in with both feet. As a result, my trading account bounced around like a Yo-Yo on a string.