
Last Updated: September 21, 2016
Imagine a mountain engulfed in flames. What a sight that would be! When I picture a Bearish Engulfing pattern, I think of that imaginary mountain. There are prices rising upward, creating one half of the mountain, a black candlestick engulfing a white candlestick at the top, and then the inevitable downward movement creating the other half of the mountain. This bearish candlestick pattern is important for investors to know, and luckily it’s easy to identify and interpret. We’ve already discussed its bullish brother, the Bullish Engulfing pattern, so today it’s time we gave the Bear its turn.

Bearish Engulfing Pattern
Formation
Ready to get started? Before we go any further, you need to know how to identify the Bearish Engulfing pattern. Look for the following criteria:
First, there should be a definable uptrend in progress. Second, the first candle must be a white (bullish) candlestick. Third, the second candlestick must be black (bearish). Fourth, that black candlestick must completely cover the white candle (i.e., engulf it). So, the top of the black candle’s body must be above the top of the white candle’s body, and its bottom must be below the bottom of the white candle’s body.
If you spot the opposite of this formation (a downtrend followed by a black candle that is engulfed by a white candle), you might have a Bullish Engulfing pattern on your hands. Check out this previous post to learn about its appearance and implications.
Meaning
Before the Bearish Engulfing pattern occurs, the bulls must be in control, creating a definite uptrend. They continue that upward push during the crucial time period, creating a gap up from the white candle to the black candle. However, the escalation ends there, when the bears take over and force the price downward, so the day closes lower than the previous day opened. The signal conveys a very drastic change in investor sentiment, and you can predict that a reversal is on the horizon.
To learn more about the specific Bearish Engulfing pattern that you’ve spotted, keep an eye out for these characteristics:
- If the preceding uptrend is substantial, the pattern will likely be effective.
- The lower the bottom of the engulfing candlestick’s body, the more powerful the signal is.
Examples
Now that you’ve learned how to identify the Bearish Engulfing pattern and you understand what it conveys about the market, let’s see what it looks like in the real world. We’ve found four examples, so that you can test your newfound knowledge. Do you think you could identify the Bearish Engulfing patterns in the examples below if they weren’t labeled and marked with blue arrows? More importantly, do you think you could discern the pattern’s message and make the right move before the subsequent candles appeared?
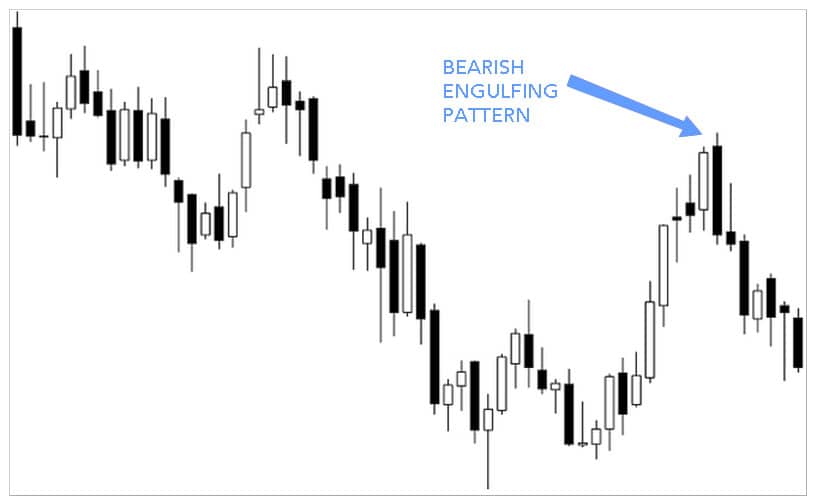
EXAMPLE 1:
With this first example, let’s start by discussing the uptrend that precedes the indicated Bearish Engulfing pattern. This stretch of the chart contains several long bullish candles and just a couple of doji with long shadows. However, the last long white candle is engulfed by an even longer bearish candle, forming a Bearish Engulfing pattern. As expected, this reverses the formerly strong uptrend. A downtrend follows, and when the chart ends, the price is still moving downward.
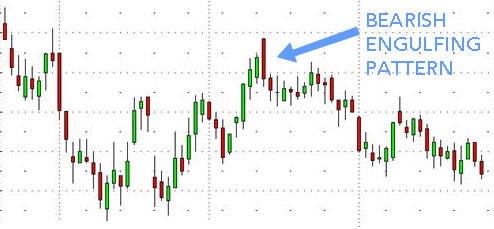
EXAMPLE 2:
In this example, again we see a persistent uptrend that ends with a large red candle, forming a Bearish Engulfing pattern. Although the price dips down as expected, it doesn’t stay there long. Anyone expecting the trend to turn upside down may be disappointed with the result. After middling around, however, the price does continue to drop. So although the Bearish Engulfing pattern did not herald the arrival of a solid and clearly dependable downtrend, it got there in the end.
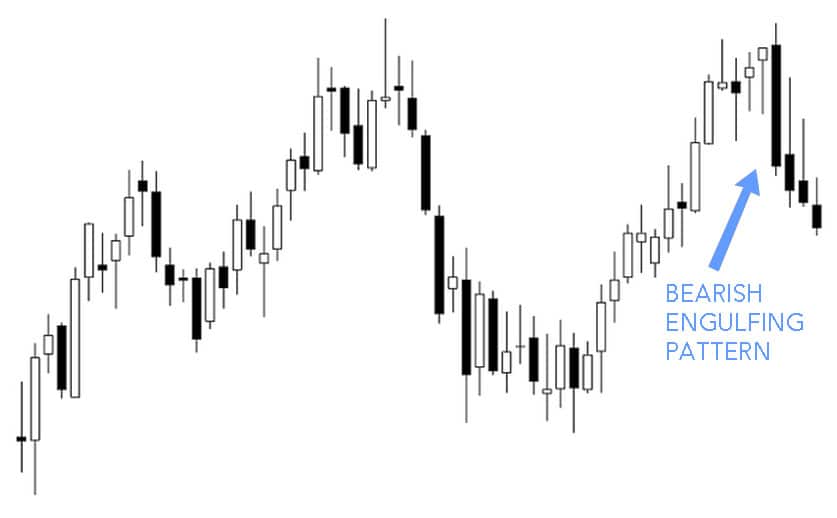
EXAMPLE 3:
This third example shows a very powerful and secure uptrend composed of twelve bullish candles and a couple of bearish doji. The concluding white candle has a very tiny body, which makes it easy for the next candle to engulf it. And in fact, it doesn’t just cover the white candle; it swamps it with an enormous black candle. As expected, the price quickly falls after that. Only bearish candles follow.
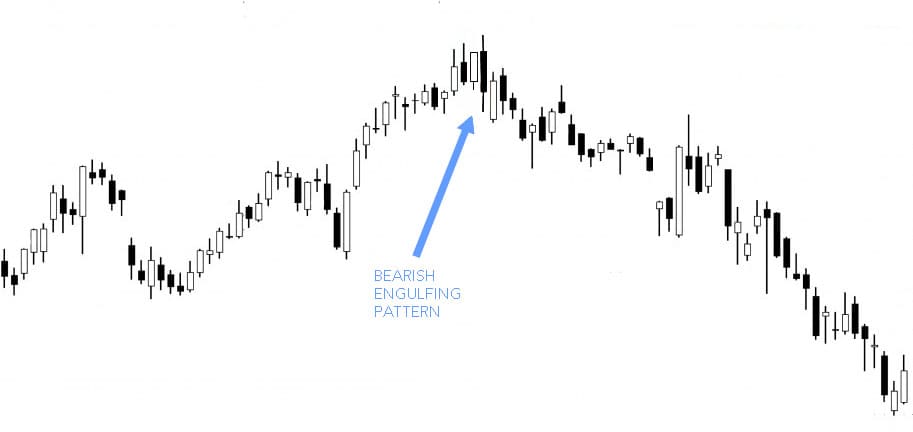
EXAMPLE 4:
In our final example of the Bearish Engulfing pattern, we have a lengthy chart that hops around quite a bit in price. Focus on the center of the chart, where the price slowly escalates up toward the middle. At the peak, a black candle just manages to envelop a white candle, forming the Bearish Engulfing signal. Because the two candles involved are not very different in length, the strength of the pattern is minimal. Although a downtrend follows, it isn’t as steep as it could be and it contains several white candles.
To test your knowledge further, look for the Bullish Engulfing patterns within this stretch of candles. How does the market respond to their presence? Does the sentiment of the investors quickly and dramatically transition from bearish to bullish?
– – – – –
Of course, you will need to confirm the presence of any Bearish Engulfing pattern before you act on it. Take the preceding and following days’ prices into account, confirming that the subsequent candlestick is setting up a downtrend. Remain calm, study the facts, and make a logical decision. Although you can’t ever be certain when it comes to the stock market, you can always do your best to make an educated guess.
Good luck!
If you’re interested in mastering some simple but effective swing trading strategies, check out Hit & Run Candlesticks. Our methods are simple, yet powerful. We look for stocks positioned to make an unusually large percentage move, using high percentage profit patterns as well as powerful Japanese Candlesticks. Our services include coaching with experienced swing traders, training clinics, and daily trading ideas. To sign up for a membership, please click here.


Comments are closed.