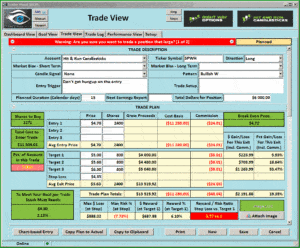
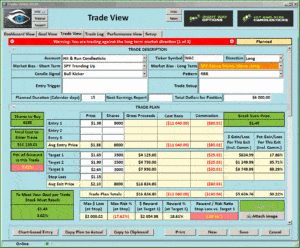
 SWKS Option Trade of the Week | Video Reply
-
- Trade Alert issued on May 5, 2017.
- Currently Holding.
- Trending stock breakout with a Bull Put Credit Spread.
- Currently a 58% gain as of the close May 12, 2017.
30-Day Trial | Hit & Run Candlesticks or Right Way Options
Investing and Trading involves significant financial risk and is not suitable for everyone. No communication from Hit and Run Candlesticks or it’s associates should be considered as financial or trading advice. All information is intended for Educational Purposes Only. Terms of Service
Price Below the Upper T-Line Band is a Warning
(SPY) – Price below the Upper T-Line Band is a warning, price below the Lower T-Line Band is a clue the Bears out number the Bulls. On May 11 I wrote, “ Last Weeks-Channel Looking to Get Tested I put the top channel line about $238.80 and the bottom about $237.70.”
Yesterday the sellers were a mission to drive the price lower. However, the Bulls rallied back on a Tweezer Bottom closing the day with a Hammer at $239.38. Candlestick tip: Hammers require confirmation. Bases on the early morning numbers it looks like we are going to open inside the T-Line Bands and inside the Hammer handle.
Yesterday WAC gave an early morning entry then rallied 19%, WAC took out 2 of our targets.
FREE Trade Idea – SPWH
SPWH Has been constructing a reversal bottom for the past two months. This week SPWH broke out of a Bullish “W” pattern and Wednesday it became a Bullish Rounded Bottom Breakout. Traded and managed correctly I see a possible 20% plus trade.
 [button_2 color=”light-green” align=”center” href=”https://hitandruncandlesticks.com/hrc-rwo-30-day-offer/” new_window=”Y”]30-Day Trial to Hit and Run Candlesticks Click Here[/button_2]
What is a Trade Idea Watch List?
A trade idea watch list is a list of stocks that we feel will move in our desired direction over a swing trader’s time frame. That time could be one to 15 days for example. From that watch-list, we wait until price action meets our conditions for a trade.
Investing and Trading involve significant financial risk and is not suitable for everyone. No communication from Hit and Run Candlesticks Inc. is not financial or trading advice. All information is intended for Educational Purposes Only. Terms of Service
Choppy price action continues. Will the consumer break the tie?
 Choppy price action is very difficult for all traders to manage. This week I have been warning of the dangers of being overly long the market when resistance has been so difficult to breach. So far we have been lucky that the Bulls and Bears have remained equally matched. The tie breaker could be today when we get a read on the strength of the consumer. I think it would be wise to prepare plans for both a break of resistance and support. Because we have been in such a tight range for so long, pressure continues to build and price move on any break could be substantial. Be prepared!
On the Calendar
Today on the Economic Calendar we have the Consumer Price Index and Retail Sales reports at 8:30 AM Eastern time. I think both of these numbers will be of utmost importance and will likely set the direction for the market. At 10:00 AM we get a reading on Business Inventories and Consumer Sentiment. So far every single day this week there have been Fed speakers and Friday will be no different with three speakers. On the Economic Calendar, there are only 60 companies reporting, but that is not an excuse to stop checking. It only takes one report like SNAP to destroy a traders progress. Always find out when a company reports and have a plan to protect your capital.
Action Plan
I need to be a flexible this morning and have a couple of plans prepared. I”m think today will hinge on the strength of the consumer. With the overall market chopping sideways at resistance the Retail Sales numbers could easily be the deciding factor on direction. As a result to be prepared with a couple of plans.
If the numbers are really good and the market reacts positively, I want to prepare for a potential upside breakout. If this occurs will want to hang on to existing positions and even look for new trades that are set up. Toward the end of the day, I will have to make decisions on individual positions; take profits, or hold through the weekend.
If the numbers show weakness in the consumer, the market will likely react negatively. With price support so close it could easily give way allowing the market to tumble lower. In that event, I want to be ready and willing to close profitable positions and protect capital on trades losing money. Obviously, a negative close below support could lead to more selling early next week. Consequently, I would want to go into the weekend with less exposure to the market.
[button_2 color=”orange” align=”center” href=”https://youtu.be/rL23IzyUxls”]Morning Market Prep Video[/button_2]
Trade Wisely,
Doug
Price And The T-Line Still Have a Bullish Attitude
(SPY) – Price and the T-Line still have a bullish attitude; The T-Line still has a bullish lift to it and price is not applying down pressure, at least as of yesterday’s close. Keep your eye price action, watch and listen to the story it tells.
We are finding that no matter what the indices do we can find a chart (s) that finds their path to bullishness. IPXL up 17% – SEDG up 30% – TDOC is 40% – VRX up 31% – these are trades that our members have been able to trade because the are trades we had presented to them before they made their move.
FREE Trade Idea – WAC
WAC painted a Bull Kicker yesterday and stepped into the Rounded Bottom Breakout circle. I also see a Morning Star and a Doji Continuation signal on a 3-day chart.

What is a Trade Idea Watch List?
A trade idea watch list is a list of stocks that we feel will move in our desired direction over a swing trader’s time frame. That time could be one to 30 days for
example. From that watch-list, we wait until price action meets our conditions for a trade.
Investing and Trading involve significant financial risk and is not suitable for everyone. No communication from Hit and Run Candlesticks Inc. is not financial or trading advice. All information is intended for Educational Purposes Only. Terms of Service
Campbell or this website is not financial or trading advice. All information is intended for Educational Purposes Only.
[button_1 text=”Need%20Help%20From%20A%20Trading%20Coach%3F” text_size=”32″ text_color=”#000000″ text_bold=”Y” text_letter_spacing=”0″ subtext_panel=”Y” subtext=”Click%20Here%20to%20See%20Our%20Coaches” subtext_size=”15″ subtext_color=”#fb2323″ subtext_letter_spacing=”0″ text_shadow_panel=”N” styling_width=”40″ styling_height=”30″ styling_border_color=”#000000″ styling_border_size=”1″ styling_border_radius=”6″ styling_border_opacity=”100″ styling_shine=”Y” styling_gradient_start_color=”#ffff00″ styling_gradient_end_color=”#ffa035″ drop_shadow_panel=”N” inset_shadow_panel=”N” align=”center” href=”https://hitandruncandlesticks.com/private-personal-coaching-right-from-the-pros/” new_window=”Y”/]
The Bull’s showed resilience defending price support.
 Defending price support with the Bears on the attack was important yesterday but price resistance continues to pose a problem. I have to admit that the Bulls displayed much more resilience than I was expecting. Great job Bulls! As a result, I want to be very bullish, but the fact remains that both the DIA and the SPY remain in a sideways consolidation. Don’t get me wrong I’m very grateful the Bulls defended the borders but they still seem to lack the energy to breakout. Futures are suggesting the Bears may be trying to regroup to mount another offensive this morning. Can the Bulls continue to hold?
On the Calendar
The Economic Calendar kicked off early today with a Fed speaker at 6:25 AM Eastern. The good news is that’s the only Fed member with something to say today! Is it just me, or does anyone else miss the days when the Fed was a lot more tight lipped? LOL. The weekly Jobless Claims numbers are a 8:30 AM as is the biggest number of the day Producer Price Index. On the earnings front, we will receive reports from over 300 companies today. The earnings calendar finally begins to lighten up next week and slowly wind down this quarter’s reports.
Action Plan
If the Bulls continue to show resilience defending support as well as they did yesterday, we will be in good shape. However, the Bears are attacking again this morning with the futures pointing to a lower open. Currently, hold 13 long positions I think is necessary to exercise a little caution on entering new trades. At the close of yesterday, all 13 positions were winners, so my top priority will be managing current trades and possibly taking some profits.
With the majority of the open positions being tech related I will keep a close eye on the QQQ. If there is a weakness there, I will be more inclined to start banking gains and reduce risk. I suggest everyone tighten up your stops. Remember trades can happen much faster than it’s possible to send out alerts. If you’re happy with the gain, take it. You can never go broke taking a profit!
[button_2 color=”green” align=”center” href=”https://youtu.be/WOuRqUx8tdk”]Morning Market Prep Video[/button_2]
Trade Wisely,
Doug
Last Weeks-Channel Looking to Get Tested
Based on yesterday’s Bearish Engulf on the SPY chart, last week’s channel is looking to get tested. I put the top channel line about $238.80 and the bottom about $237.70. As of yesterday’s close, the bullish trend remains in tack, a close below the channel top line would put a little pressure on the Bulls and a close below the bottom line would give the Bears the advantage. The Bulls had a terrific chance to breakout but gave up, kind of makes a swing trader wonder.

FREE Trade Idea – WLH
WLH printed a Bullish Engulf yesterday breaking out of J-Hook continuation pattern. WJH is also finishing a bullish Cup and Handle pattern. This will be an easy chart to trade with a plan and the correct tools. We will talk more about the trading tools with our members.
Charts To Study For Education– KRO
KRO has trended 41% from the time we shared this trade with our members. There have been several chances to trade KRO along the way. Currently, on the 2-day chart, the Bullish Morning Star suggest the buyers still outnumber the sellers.
Members Swing Trade Ideas
10-15 Swing Trade Ideas are shared with members each day
[button_2 color=”light-green” align=”left” href=”https://hitandruncandlesticks.com/hit-and-run-candlesticks/” new_window=”Y”]Join a Winning Trading Club[/button_2]
What is a Trade Idea Watch List?
A trade idea watch list is a list of stocks that we feel will move in our desired direction over a swing trader’s time frame. That time could be one to 30 days for example.
From that watchlist, we wait until price action meets our conditions for a trade.
Investing and Trading involve significant financial risk and is not suitable for everyone. No communication from Hit and Run Candlesticks Inc. is not financial or trading advice. All information is intended for Educational Purposes Only. Terms of Service
Campbell or this website is not financial or trading advice. All information is intended for Educational Purposes Only.
Bearish engulfing price action at resistance. Bears gain the advantage.
 The bearish engulfing candles left behind yesterday on the DIA and SPY put the Bears in temporary control of market direction. The fact that they took control right a price resistance is also very important as well as concerning. Clearly daily supports are still in place, but we should expect at a minimum a strong challenge. There is no need to panic but caution flags and warning lights are flashing. This bearish attack could be short lived but it could also be the first warning sign that this bull run has come to and end. The Bulls will certainly fight back but we should never ignore the seriousness of a potential failure at resistance. Plan accordingly.
On the Calendar
The Economic Calendar starts to heat up today with some important reports through weeks end. Import and Export Prices kick things off at 8:30 AM Eastern time followed by the Petroleum Status Report at 10:30 AM. This afternoon at 2 PM the Treasury Budget will be released. Of these reports, the most likely to move the market is the Oil Status Report. Also noteworthy are the two mid-day Fed speakers. The Earnings Calendar has over 350 companies reporting today.
Action Plan
The last couple days I have been warning about the dangers of getting overly long a market that’s struggling to break resistance. Yesterday afternoon the Bears began to overwhelm the Bulls breaking intraday support levels. This morning the Bears continue their offensive with futures number suggesting the Dow will gap down about 50 points.
Watch your positions closely this morning and be prepared to take profit or exit trades to stop losses if necessary. The SPY and the QQQ seem to be less affected, but if the DIA continues to push lower, it certainly has the power to pull the other indexes down. So at least for this morning, the plan will be account management, possible profit taking, and capital preservation. Keep in mind that daily supports are still in place, so there is no reason to panic, but we also don’t want to bury our heads in the sand. Always be prepared to act.
[button_2 color=”green” align=”center” href=”https://hitandruncandlesticks.sharefile.com/d-s79ff33998be4c10b”]Morning Market Prep Video[/button_2]
Trade wisely,
Doug
 SWKS Option Trade of the Week | Video Reply


