HZNP Printed A Bullish Engulf Yesterday

HZNP Printed A Bullish Engulf Yesterday

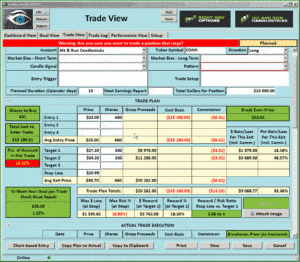
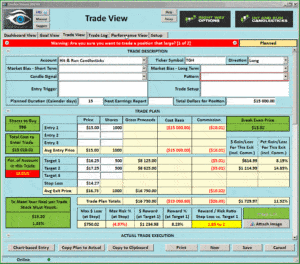
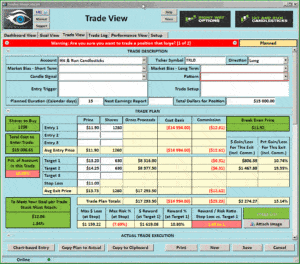
HZNP Printed A Bullish Engulf Yesterday (Horizon Pharma PLC) $HZNP printed a Bullish Engulf yesterday after a 3 Doji pull back. The price action has been rising with the T-Line and the 34-ema crossing over the 50-sma. The past 5 days has created a Pop Out OF The Box Pattern. Learn more about Hit and Run Candlesticks, and today’s trade idea plus the 10 or more members trade ideas, starting at 9:10 EST AM every morning.


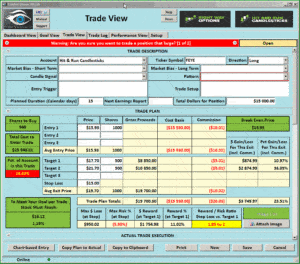
We are still holding IPI Plus 13.79%

Education on how to manage a trade from start to finish is vital to a swing traders success.

With on-demand recorded webinars, eBooks, and videos, member and non-member eLearning, plus the Live Trading Rooms, there is no end your trading education here at the Hit and Run Candlestick, Right Way Option, Strategic Swing Trade Service and Trader Vision.
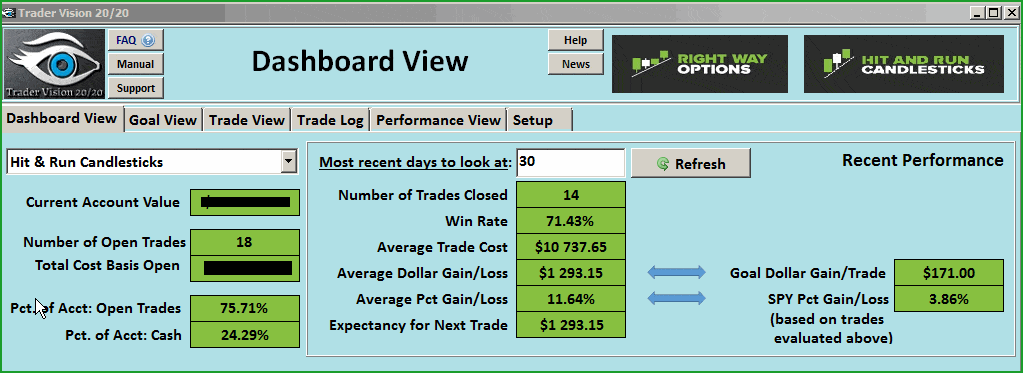
 

BAS was first presented to HRC members on June 28,

Now up 13.02%. BAS started out as a Pinball set-up then went into the Rounded Bottom Breakout. With a rally followed by a Bullish Morning Star, PBO BAS looks ready to follow through on a J-Hook continuation pattern.


Eyes On The Market

Today is the start of Miss Janet talking to Congress; I suspect the market will be a bit dizzy before it makes a direction decision. Plus, earnings season is about to kick off. I find it very helpful if I watch what price does and compare it to the T-Line performance.

What is a Trade Idea Watch-list?

A trade idea watchlist is a list of stocks that we feel will move in our desired direction over a swing trader’s time frame.  That time could be one to 15 days for example. From that watchlist, we wait until price action meets our conditions for a trade.

MEMBERS ONLY


Investing and Trading involve significant financial risk and are not suitable for everyone. No communication from Hit and Run Candlesticks Inc. is financial or trading advice. All information is intended for Educational Purposes Only. Terms of Service.

Rick Saddler is not a licensed financial adviser nor does he offer trade recommendations or advice to anyone except for the trading desk of Hit and Run Candlesticks Inc.

 

Price resistance holds strong.

Price resistance holds strong.

Price resistanceThe Bulls tried once again to break through price resistance yesterday day but once again did not have quite enough energy to do so.  The newly driven whipsaw left behind nice hammer patterns but it’s important to remember that that placement of this pattern is very important.  A hammer pattern at support is important.  The same pattern is drawn in a light volume rally that remains under resistance, not so much.  If fact some might call it a hanging man pattern at price resistance.  With the futures pointing to a gap up this morning, please keep in mind this is the perfect setup for a pump and dump whip whipsaw.  Don’t allow the emotion whipped up in the premarket to influence your trading decisions.

On the Calendar

Today Economic Calendar is dedicated to Janet Yellen.  The Fed Chair will deliver her opening statement in front fo the House Financial Committee at 8:30 AM Eastern.  She will then follow that up with the semiannual monetary policy testimony at 10:00 AM.  At 10:30 AM today we get the EIA Petroleum Status Report which last time showed a nice decline in supplies and helping oil companies find some support.  Today lets hope this trend continues.  At 2:00 PM is the Beige Book which may shed light on next FOMC action with the compiled data that influences their decision.  Lastly at 2:15 PM we have another Fed speaker to round out the day.

There are 21 companies reporting earnings today as we slowly ramp up 3rd quarter reports.  Please remember to make checking report dates part of your morning preparation.

Action Plan

Yesterday saw another day of choppy price action with a news-driven whipsaw tossed in for good measure.  Unfortunately, the overall technical picture of the charts really didn’t change.  Resistance continues to be stronger than the will of the Bulls thus far.  The DIA remains the strongest of the indexes and the one most likely to lead the market higher if only it could break out.  Currently, futures are pointing to a higher open but keep in mind the market will hang on each utterance from Janet Yellen’s mouth today.  Be prepared for the possibility of whippy price action.

Flipping through the charts last night, I found a lot of possible setups for both long and short trades.  Personally, I remain bullish on the overall market but the fact all the indexes remain under resistance levels leaves a reason for concern.  With futures pointing to gap up into resistance I have to consider the possibility of a pump and dump.  As a result, I will give the market at least 30 minutes after the open before considering new trades just to make sure the bullishness attracts real buyers.

[button_2 color=”green” align=”center” href=”https://youtu.be/gc_G4dPZOmk”]Morning Market Prep Video[/button_2]

Trade Wisely,

Doug

INAP Has Printed A Doji Continuation Pattern

INAP Has Printed A Doji Continuation Pattern

INAP Has Printed A Doji Continuation Pattern (Internap Corp) INAP Has Printed A Doji Continuation Pattern after breaking out of price action resistance and the big 3 moving averages. The past week or so INAP been in a tight consolidation with a bullish breakout (This is a Pop Out of The Box Pattern). On the 3-day chart, you can see an RBB setup coming off the dotted deuce turning up to the 200-sma. Learn more about Hit and Run Candlesticks, and today’s trade idea plus the 10 or more members trade ideas, starting at 9:10 EST AM every morning.  30-Day Trial

With on-demand recorded webinars, eBooks, and videos, member and non-member eLearning, plus the Live Trading Rooms, there is no end your trading education here at the Hit and Run Candlestick, Right Way Option, Strategic Swing Trade Service and Trader Vision.

Yesterday We Closed IMGN for an 18% Profit

[button_1 text=”%241000%20invested%20in%20IMGN%20at%2018%25%20is%20%241180.” text_size=”32″ text_color=”#000000″ text_bold=”Y” text_letter_spacing=”0″ subtext_panel=”Y” subtext=”Try%20Us%20Out%201-Month” subtext_size=”22″ subtext_color=”#3542f8″ subtext_bold=”Y” subtext_letter_spacing=”0″ text_shadow_panel=”N” styling_width=”40″ styling_height=”30″ styling_border_color=”#000000″ styling_border_size=”1″ styling_border_radius=”6″ styling_border_opacity=”100″ styling_shine=”Y” styling_gradient_start_color=”#ffff00″ styling_gradient_end_color=”#ffa035″ drop_shadow_panel=”N” inset_shadow_panel=”N” align=”center” href=”https://hitandruncandlesticks.com/hit-and-run-candlesticks/” new_window=”Y”/]


AGEN was first presented to HRC members on July 5,

Now up 12%. The Rounded Bottom Breakout pattern brings money to the table again. After a few bars of consolidation, a 9% pop close AGEN over the dotted deuce. Double-digit target ahead.

Eyes On The Market

For the most part, the market has been walking around looking for a path but can’t seem to find it. There is not a candle signal or pattern that’s giving a clue to the next market direction. For now, we will remain in mostly long positions a few short.

The overall market remains vulnerable as the Bear works for more control. As of the close Friday, I feel the Bull still has control, and the Bear has been a pain in you know what. On the SPY, DIA, and IWM charts the T-Line is still in bullish territory, The T-Line on the QQQs have slipped below itself.

What is a Trade Idea Watch-list?

A trade idea watchlist is a list of stocks that we feel will move in our desired direction over a swing trader’s time frame.  That time could be one to 15 days for example. From that watchlist, we wait until price action meets our conditions for a trade.

MEMBERS ONLY


Investing and Trading involve significant financial risk and are not suitable for everyone. No communication from Hit and Run Candlesticks Inc. is financial or trading advice. All information is intended for Educational Purposes Only. Terms of Service.

Rick Saddler is not a licensed financial adviser nor does he offer trade recommendations or advice to anyone except for the trading desk of Hit and Run Candlesticks Inc.


Price Resistance proves stronger than the Bulls.

Price Resistance proves stronger than the Bulls.

The Bulls stayed in control yesterday, but resistance levels proved to be stronger.  It seems a lot of the Bulls decided to avoid the summer heat and hung out in the barn as volume was very low yesterday.  Price action was understandably choppy as a result.  Technically speaking nothing changed yesterday.  Indexes remain under price resistance, and light volume rallies don’t inspire much confidence.

Boredom is dangerous for most traders.  Rather than just sit and watch as we break discipline and trade just to have something to do.  Allways keep in mind that you are the CEO of your trading business and it’s your job to maintain the discipline and stick to your plan.

On the Calendar

Tuesday’s Economic Calendar begins with the JOLTS numbers at 10:00 AM Eastern.  This month job openings are expected to slip slightly lower to 5.975 million.  Lately, openings have been running about 1 million above totals for hiring.  Wholesale Trade is also at 10:00 AM but is normally a non-market moving number.  We have Fed speakers at 12:30 PM and 1:20 PM to round out calendar today.

On the Earnings Calendar, we have 17 companies expected to report earnings today.  One to keep an eye on is PEP as the consumer defensive stocks have been showing signs of strength of late.  If you are not already in the habit of checking earning reports before entering new trades now would be a good time to start.  Next week we will begin ramping up with 100’s of reports daily.  Not knowing can cost you a lot of money.

Action Plan

Yesterday saw the Bulls matain control but sadly lacked the energy to break overhead resistance levels. Futures are currently pointing to a flat to slightly lower open this morning.  The overall market seems to lack inspiration and is simply marking time with choppy low volume price action.  With both economic and earnings news continuing to be on the light side we may have to wait a little longer for that inspiration to appear.

I will be looking for new bullish trades today, but as we approach resistance levels, I must also keep my mind open for bearish positions if failure patterns begin to show up in the charts.  The market itself is in a slow, plodding mood, so there is no need to rush into new trades.  Even the best fo the best setups are having difficulty performing in this environment.  Stay disciplined and always remember that cash is a position.

[button_2 color=”green” align=”center” href=”https://youtu.be/nKvnnizpF74″]Morning Market Prep Video[/button_2]

Trade Wisely,

Doug

Friday’ relief rally requires follow-through.

Friday’ relief rally requires follow-through.

Follow-ThroughIt was nice to have a relief rally Friday taking some of the pressure off the market.  However, that is all that it turned out to be because the Bulls lacked the energy to break resistance levels.  I think it is entirely possible that was we saw and Friday was nothing more than a short covering rally short traders captured gains before the weekend.  So today I need to see some follow-through by the Bulls and some proof they are truly there to support price.

Discipline to follow your rules and stick with your plan is very important in this market.  Years ago I would allow times like this to chop my account to pieces trying to trade without a plan and a good set of rule to protect me.  Not only would I see my hard earned capital disappear, but my confidence as a trader would evaporate as well.  I call it Yo-Yo trading and it nearly destroyed me.  Today as a confident and consistently profitable trader I can tell you it’s the plan and the discipline to follow rules that make the difference.  Having a plan and profit or fail to plan and suffer the consequences.  It’s all up to you!

On the Calendar

A light day on the Economic Calendar for this first full week of trading in July.  We have a couple of insignificant economic reports a few bond auctions and a Fed speaker after 11 PM Eastern.  The Earnings Calendar only has 11 companies that are reporting today.  I would not expect any of the earnings reports today to be market moving.

Action Plan

As always my priority will be to manage the positions that I currently hold.  After that, I will be looking for new trades and refining my watchlists.  I will also look for possible short trades particularly if the failure patterns begin to emerge on the index charts near price resistance.  With earnings just around the corner, we could see light volume and choppy price action all week.  Plan accordingly.

[button_2 color=”green” align=”center” href=”https://youtu.be/mIjsvyl0K_Q”]Morning Market Prep Video[/button_2]

Trade Wisely,

Doug

$WTW Bullish Pop Out of The Box

$WTW Bullish Pop Out of The Box

$WTW Bullish Pop Out of The Box

WTW (Weight Watchers Intl Inc) WTW Bullish Pop Out of The Box. About June 23 the chart started to form a tight range, what we call a box. Friday price popped out of the box signaling the Buyers are motivated to push WTW higher. The weekly chart is trying to put together a Doji Continuation pattern. Learn more about Hit and Run Candlesticks, and today’s trade idea plus the 10 or more members trade ideas, starting at 9:10 EST AM every morning.  30-Day Trial


[button_1 text=”Learn%20To%20Swing%20Trade%20-%2030-Day%20Trial” text_size=”32″ text_color=”#000000″ text_bold=”Y” text_letter_spacing=”0″ subtext_panel=”Y” subtext=”Take%20The%20First%20Step” subtext_size=”15″ subtext_color=”#2341f6″ subtext_bold=”Y” subtext_letter_spacing=”0″ text_shadow_panel=”N” styling_width=”40″ styling_height=”30″ styling_border_color=”#000000″ styling_border_size=”1″ styling_border_radius=”6″ styling_border_opacity=”100″ styling_shine=”Y” styling_gradient_start_color=”#ffff00″ styling_gradient_end_color=”#ffa035″ drop_shadow_panel=”N” inset_shadow_panel=”N” align=”center” href=”https://hitandruncandlesticks.com/hrc-rwo-30-day-offer/” new_window=”Y”/]

KTOS was first presented to HRC members on June 14,

Now up 11.12%. Price is drawing a J-Hook continuation pattern supported by the T-Line. Last Wednesday price formed a piercing candle with legs setting up the J-Hook pattern up.


Eyes On The Market

The overall market remains vulnerable as the Bear works for more control. As of the close Friday, I feel the Bull still has control, and the Bear has been a pain in you know what. On the SPY, DIA, and IWM charts the T-Line is still in bullish territory, The T-Line on the QQQs have slipped below itself.

What is a Trade Idea Watch-list?

A trade idea watchlist is a list of stocks that we feel will move in our desired direction over a swing trader’s time frame.  That time could be one to 15 days for example. From that watchlist, we wait until price action meets our conditions for a trade.

MEMBERS ONLY


Investing and Trading involve significant financial risk and are not suitable for everyone. No communication from Hit and Run Candlesticks Inc. is financial or trading advice. All information is intended for Educational Purposes Only. Terms of Service.

Rick Saddler is not a licensed financial adviser nor does he offer trade recommendations or advice to anyone except for the trading desk of Hit and Run Candlesticks Inc.
 

Average Hourly Earnings In Focus

Average Hourly Earnings In Focus

Average Hourly EarningsThe Employment Situation report is always very important to the market, but today I think the focus will be on the Average Hourly Earnings.  With three of the four major indexes closing below their 50-day averages this largely ignored number is likely to set the direction of the market today.  I have been warning of caution for so long it’s become tiring, but my caution has paid by protecting my capital.  Sadly I must continue to say caution is warranted.  I think a relief rally is near, but that is not a signal of bullishness.  We must keep in mind the index’s now must deal with overhead resistance.  A rally could prove to be the time to sell not a time to buy.  Also, remember with the VIX moving higher the possibility of very fast reversals increases so the traders must be prepared for anything.

On the Calendar

Today we get one of the most important reports on the Economic Calendar, the Employment Situation.  Most of the time the market is laser focused on the Jobs creation number.  However, with the unemployment rate expected to hold at 4.3% (considered as full employment) focus has turned to wage growth.  If the U.S. consumer-based economy is to grow then, consumers need to have the ability to spend more.  Wage growth has been lagging behind for years, and the market wants to see that change.  Consensus suggests the average hourly earnings will improve from 2.5 to 2.6 this month.  A reading of anything above 2.6 I believe the market will see as very bullish.  If the number disappoints, I think we should expect Bears to gain strength.

Wage growth also signals rising inflation which in turn increases the likelihood that the FOMC will react raising interest rates.  The true double edged sword!  There is only one company, GRIF on the Earnings Calendar today which is obviously not a market moving event.

Action Plan

Yesterday we witnessed some hungry Bears pushing all the major indexes lower.   The DIA chart now has the appearance of a double top forming while still clinging to a price support and above the 50SMA.  That’s the good news!  The bad news is that the SPY, IWM, and the QQQ closed the day below their 50-day averages.  The VIX is showing that some fear created into the market yesterday while T2122 suggests we could be nearing a market bounce.  So which way will it go?

I think the tie breaker today will be in the average hourly number at 8:30 AM Eastern.  A number of 2.6 or better and I’m guessing we will see the market gap up.  If the number comes in below 2.5, I think a gap down is likely.  With that in mind, I will be keenly interested in how the market reacts to the Employment Situation report.  Personally, I favor a nice relief rally, but oddly my phone isn’t ringing with the market asking for my opinion.  Friday is normally not a day for me to consider buying new positions but if the opportunity arises, I will be prepared to do so.

[button_2 color=”green” align=”center” href=”https://youtu.be/Odr1S131ErY”]Morning Market Prep Video[/button_2]

Trade Wisely,

Doug