IDXG – Pullback (PBO) Bullish Engulf
IDXG – Pullback (PBO) Bullish Engulf
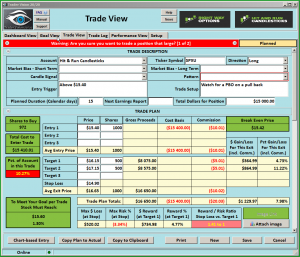
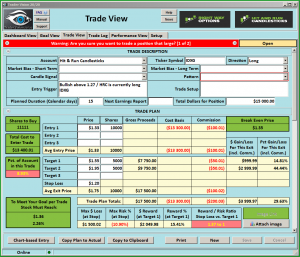 IDXG – Has presented a Pullback (PBO) Bullish Engulf yesterday after a strong rally into the Rounded Bottom Breakout strategy. The recent price action has rallied above the recently constructed bottom and our big 3 moving averages. The T-Line is above its highest 20-day high. A (PBO) is when stock rallies and prints a candlestick buy signal within the pullback. (Note we posted IDXG in StockTwits.com before the Bullish Engulf was finished and before we bought it. Look for Hit and Run Candlesticks and Right Way Options on StockTwits.com
Good Trading – Hit and Run Candlesticks
Learn more about Hit and Run Candlesticks, and today’s trade idea and plan plus the 10 or more members trade ideas, starting at 9:10 EST AM every morning. Every day we teach and trade using the T-Line, Candlesticks, Support and Resistance, Trends, chart patterns and continuation patterns.
►Trade Updates – Hit and Run Candlesticks
We picked up two more longs yesterday (IDXG) and (MDXG) they both started to act very positively.
Are you having trouble putting together a winning trade? Not sure what scans to use? So near to having multiple winning trades, but something always goes wrong. Maybe a couple hours with a trading coach could make all the difference in the world. Hit and Run Candlesticks has 4 trading coaches – Learn More about the Coaches
With on-demand recorded webinars, eBooks, and videos, member and non-member eLearning, plus the Live Trading Rooms, there is no end your trading education here at the Hit and Run Candlesticks, Right Way Options, Strategic Swing Trade Service and Trader Vision.
[button_1 text=”e-Learning%20Tonight%20August%2022%20%E2%80%A2%208PM%20Eastern” text_size=”32″ text_color=”#000000″ text_font=”Montserrat;google” text_bold=”Y” text_letter_spacing=”0″ subtext_panel=”Y” subtext=”Login%20%E2%96%BAClick%20Here%20at%20Least%2015.Min.%20Early” subtext_size=”18″ subtext_color=”#ff0000″ subtext_bold=”Y” subtext_letter_spacing=”0″ text_shadow_panel=”N” styling_width=”40″ styling_height=”30″ styling_border_color=”#000000″ styling_border_size=”1″ styling_border_radius=”6″ styling_border_opacity=”100″ styling_gradient_start_color=”#ffa035″ styling_gradient_end_color=”#ffa035″ drop_shadow_panel=”N” inset_shadow_panel=”N” align=”center” href=”http://hitandruncandlesticks.webinato.com/room2″ new_window=”Y”/]
► TECK – You would be up 22.14% or $431.00
If you bought 100 shares when we posted to our members on July 24. Hit and Run Candlesticks members practice trade management and trade planning with Price and Candlesticks, The T-line, Trend, Trend Lines, Chart Patterns, Support,
and Resistance.
► Eyes On The Market (SPY)
Yesterday we mentioned that the SPY might be ready to bounce a little as it kept trying to form a little Hammer. At this point, there is not any kind of reversal pattern so right now we can only see a possible short term relief rally. Careful not to get sucked into the bullish tunnel without the clues.
► What is a Trade Idea Watch-list?
A trade idea watchlist is a list of stocks that we feel will move in our desired direction over a swing trader’s time frame. That time could be one to 15 days for example. From that watch list, we wait until price action meets our conditions for a trade.
Rick’s personal trade ideas for the day MEMBERS ONLY
Start your education with wealth and the rewards of a Swing Traders Life – Click Here
Investing and Trading involve significant financial risk and are not suitable for everyone. No communication from Hit and Run Candlesticks Inc. is financial or trading advice. All information is intended for Educational Purposes Only. Terms of Service.
Rick Saddler is not a licensed financial adviser nor does he offer trade recommendations or advice to anyone except for the trading desk of Hit and Run Candlesticks Inc.