
Back to the Basic’s E-Learning 7-21-18
[button_2 color=”green” align=”center” href=”https://hitandruncandlesticks.sharefile.com/d-s884cc18e56642678″]Option Basics E-Learning 7-21-18[/button_2]
Do You Want The Traders Lifestyle
Do You Want The Traders Lifestyle
How would you like to average a 35% profit each month on your trading portfolio?
Well if the answer is yes, you can. Hi, my name is Rick Saddler. I do an average 35% a month or 246% for the past seven months. Here are five techniques I use.
- Base hits.
- Profit into strength.
- Price action. Do you truly understand Price action?
- Chart patterns. Do you truly understand Chart patterns?
- Charts that are trending or starting to trend.
Look your not going to learn to trade, or what it takes to trade in just a few days it takes time, and the true desire to want the lifestyle. LOL, and it is a great lifestyle. Click on the Road To Wealth link below if you want to see my trading account statement. That’s right I practice what I preach, and I don’t mind sharing the good or the bad. Yes, we all have bad days weeks or months.
Trading Results
Our “Road to Wealth” Account Statement is posted on the website for you to see and follow. 2018 YTD (Through) July) +246% See for your self. Want to learn more about how Rick Saddler does it?
HRC Trading Tools I Use
Smart Phone APP
Go to your APP store and download “HRC Trading.”
Every Day Charting – TC2000
Trade Planning – Trader Vision 2020
Trading platform and Brokerage
Trading Platform – TradeHawk
Brokerage – Tradier
Stock Only Trades – Flat $16.00 per month
Stock and Option Trades – Flat $159.00 per month
Contact Us if you have questions
Membership Services • Private 2-Hour Coaching
Past Performance Is No Guarantee of Future Results
Investing and Trading involve significant financial risk and is not suitable for everyone. No communication from Hit and Run Candlesticks Inc, Right Way Option, Trader Vision 2020 or Rick Saddler, Doug Campbell, Ed Carter, Steve Risner is to be considered financial or trading advice. All information is intended for Educational Purposes Only. Terms of Service.
Rick Saddler, Doug Campbell, Ed Carter, Steve Risner is not a licensed financial adviser nor does he offer trade recommendations or advice to anyone.
*************************************************************************************
S Setup and Trade Plan
Since I was off on Thursday, I thought I’d put out a trade idea for Friday.
Today’s Featured Trade Idea is S (Sprint).
Members can hear Rick’s detailed review in the trading room at 9:10am Eastern. For now, here is my analysis and a potential trade plan made using our Trader Vision 20/20 software.
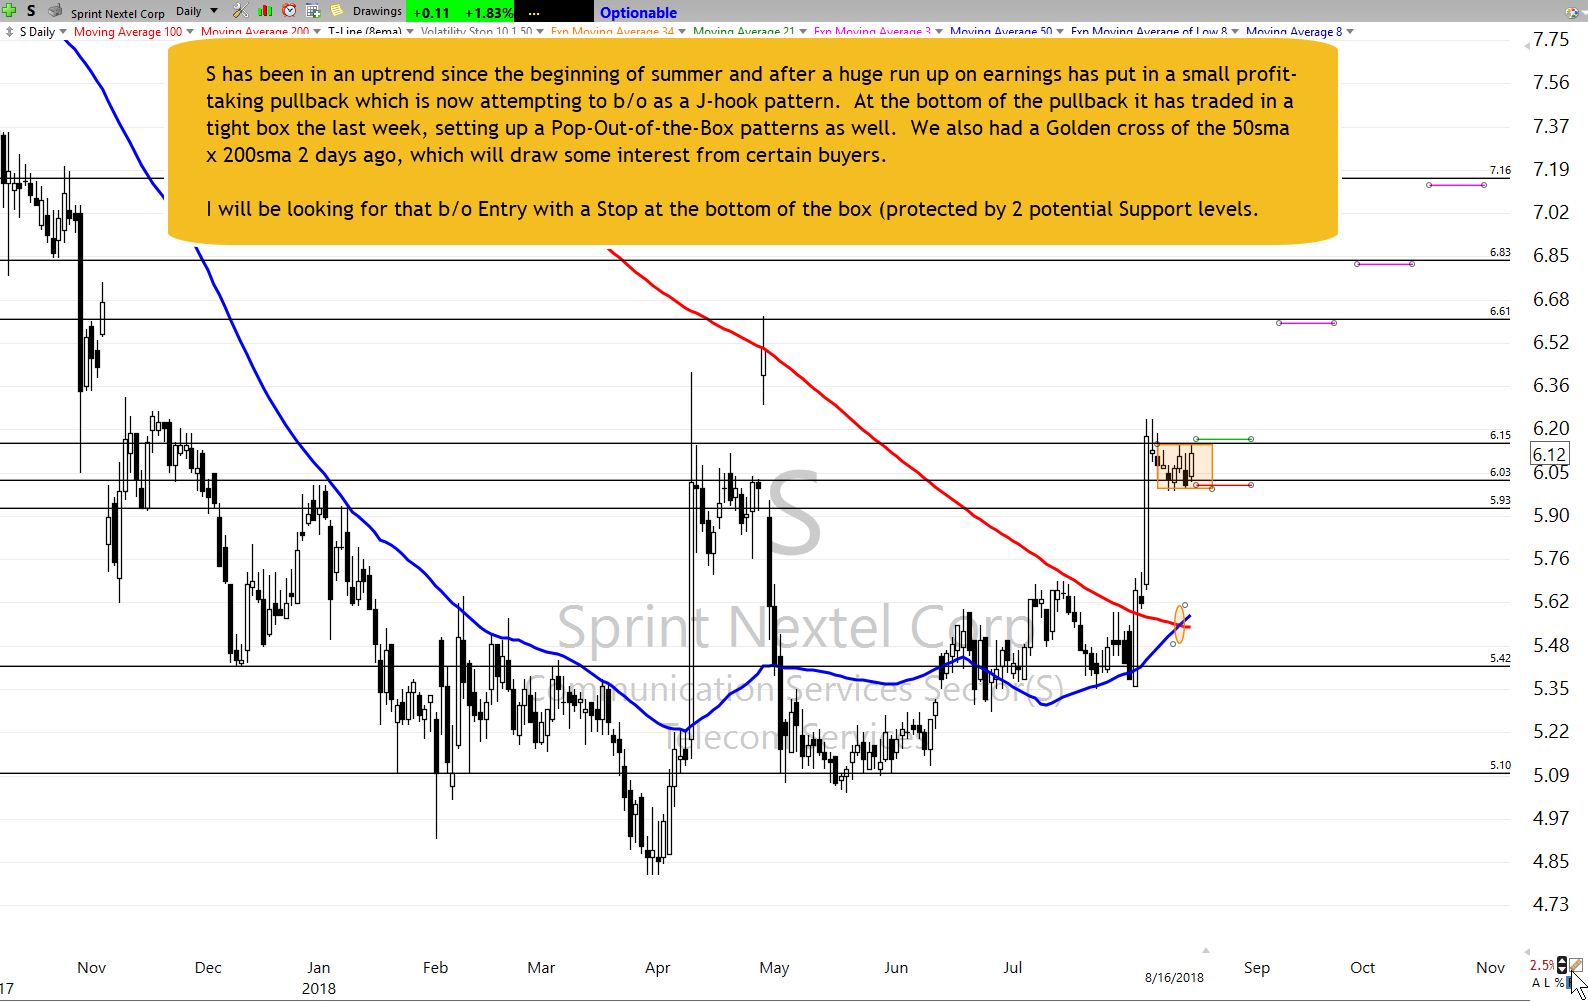
S has been in an uptrend since the beginning of summer and after a huge run up on earnings has put in a small profit-taking pullback which is now attempting to b/o as a J-hook pattern. At the bottom of the pullback it has traded in a tight box the last week, setting up a Pop-Out-of-the-Box patterns as well. We also had a Golden cross of the 50sma x 200sma 2 days ago, which will draw some interest from certain buyers.
I will be looking for that b/o Entry with a Stop at the bottom of the box (protected by 2 potential Support levels. The Targets are defined off S/R levels from the Weekly chart.
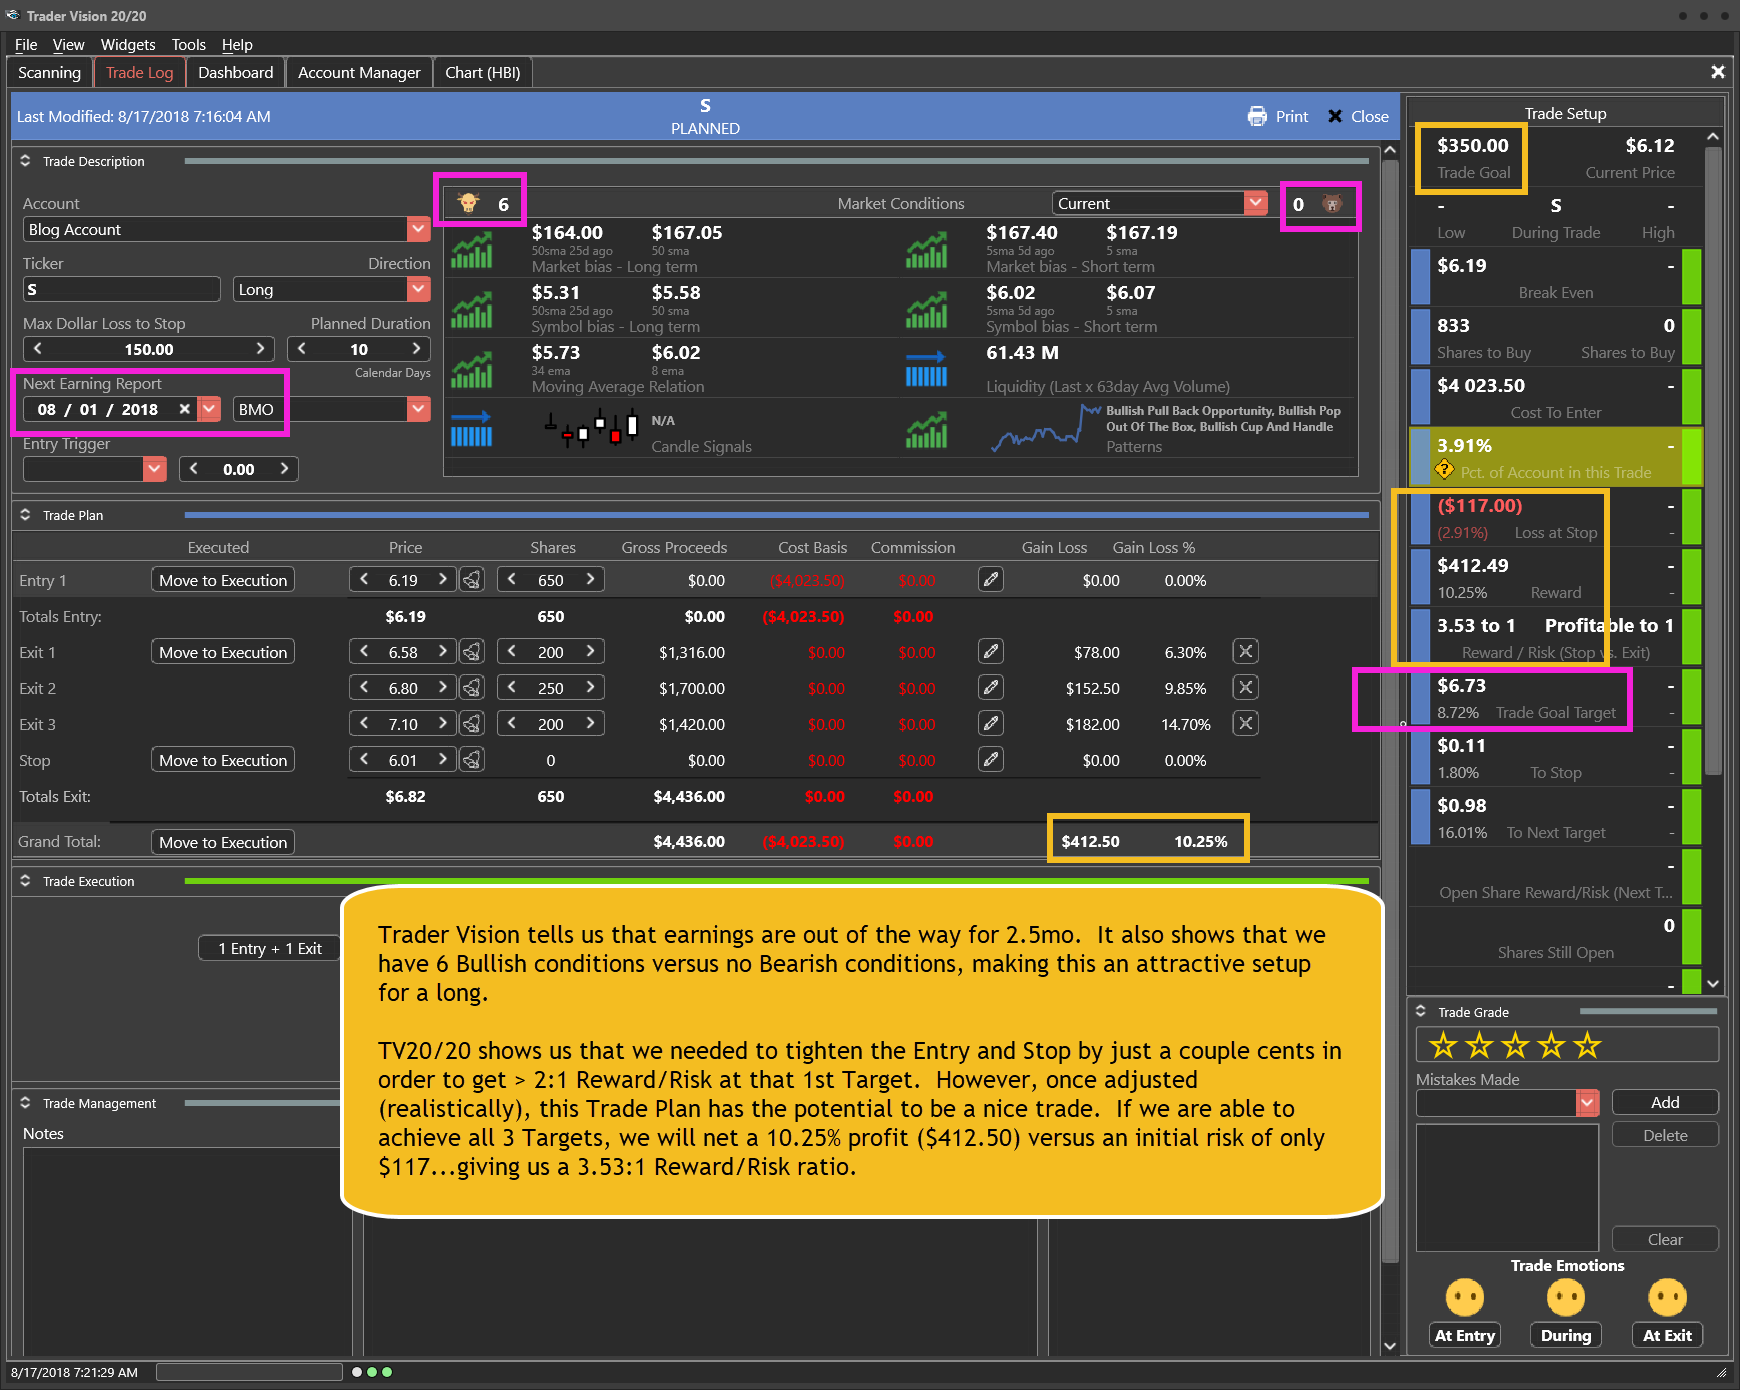
Trader Vision tells us that earnings are out of the way for 2.5mo. It also shows that we have 6 Bullish conditions versus no Bearish conditions, making this an attractive setup for a long.
TV20/20 shows us that we needed to tighten the Entry and Stop by just a couple cents in order to get > 2:1 Reward/Risk at that 1st Target. However, once adjusted (realistically), this Trade Plan has the potential to be a nice trade. If we are able to achieve all 3 Targets, we will net a 10.25% profit ($412.50) versus an initial risk of only $117…giving us a 3.53:1 Reward/Risk ratio.
Having this knowledge before a trade is even entered makes it much easier to control emotions and maintain discipline.
Below is my markup of the chart and the trade plan as laid out by Trader Vision 20/20. As a bonus, if you click the green button below, you’ll be able to watch a video of the chart markup and trade planning process.
The S Trade Setup – As of 8-16-18
The Trade Plan
Note how Trader Vision 20/20 does so much of the work for you. Knowing the ratio of Bullish Conditions to Bearish ones as well as the overall risk of the position size, risk to Stop out and the Reward possible at each Target price can help a great deal with controlling our emotions. Knowing the dollar impact of every scenario ahead of time, allows us to make calm decisions during the trade. It really takes the pressure off. No guesswork. No surprises. No emotional roller coaster.
To see a short video of this trade’s chart markup and trade planning, click the button below.
[button_2 color=”light-green” align=”center” href=”https://youtu.be/bixjoo-gpJs” new_window=”Y”]Trade Plan Video[/button_2]
Put the power to Trader Vision 20/20 to work for you…
[button_2 color=”orange” align=”center” href=”https://hitandruncandlesticks.com/product/trader-vision-20-20-monthly-subscription2/” new_window=”Y”]TV20/20 Software[/button_2]
Testimonial
Trader Vision immediately simplified the process…immediately it provided that information and guidance to me. I knew what I would risk for how much reward, I began taking trades off at the 1st target, 2nd target, I was no longer holding all my trades for the homerun. I also began implementing the stop losses if and when they were reached, not just hoping the stock would recover. It then became easier to see what patterns were working for me and which were not. It provided a much more relaxed and stress-free environment. –Joan G
***************************************************************************************************
Investing and Trading involve significant financial risk and are not suitable for everyone. Ed Carter is not a licensed financial adviser nor does he offer trade recommendations or investment advice to anyone. No communication from Hit and Run Candlesticks Inc. is to be considered financial or trading advice. All information is intended for Educational Purposes Only. Terms of Service.
***************************************************************************************************
Wildly Bullish Reaction
Wildly Bullish Reaction
 After a wildly bullish reaction to China and the US re-engaging in trade negotiations, the Dow swung more than 600 points from low to high in a single day. In my opinion that was an amazing gift that I took advantage of by taking some profits to the bank. It is very likely that I will take more profits today as we head into the weekend. Currently, the Futures are pointing to a flat open this morning.
The question on my mind is will the momentum of yesterdays rally carry us higher to test resistance levels or will profit-taking ahead of the weekend win the day. Considering the recent volatility of the market anything is possible. Set your bias aside and stay focused on the price action. Keep in mind a US-China deal has not been made. What could the market reaction be if they fail to agree? It may be wise to go to the bank today with at least some of your current profits.
On the Calendar
A lighter day on the Economic Calendar this Friday with only one potential market-moving report. At 10:00 AM Eastern Consumer Sentiment expects to remain unchanged with a very strong reading of 97.9 according to forecasters. Also at 10:00 AM we get reports on E-Commerce Retail Sales & Leading Indicators which are not expected to move the market. To close out the calendar week is the Baker-Hughes Rig Count at 1:00 PM.
We also have a rather light day on Earnings Calendar with only nine companies reporting. The most notable DE which will report before the opening bell today.
Action Plan
After rising nearly 400 points on the news that China and the US have come back to the negotiation table, it makes you wonder what the reaction would be with a completed agreement? From the Wednesday low to the Thursday high is a swing of more than 600 points! Amazing, but where do we go from here? After such a big move it would not be out of the question to see some profit taking ahead of the weekend. However, the sheer momentum of yesterdays move could also carry us a little higher to test resistance levels.
The SPY only needs to gain about 2.50 points to break an all-time high with the QQQ would have a bit more work to do, needing to rise about 3.5- points. It seems hard to imagine they could get this close and not be able to break out but this resistance level has proven itself to be difficult to breach. I personally consider yesterdays move a tremendous gift and used it to take some profits and will most likely continue doing so today. Have a wonderful weekend!
Trade Wisely,
Doug
[button_2 color=”green” align=”center” href=”https://youtu.be/aOOiZC1LzSQ”]Morning Market Prep Video[/button_2]Weekly RBB Set To Challenge Dotted Deuce VIAB • Swing Trade bullish above $30.85 • stop $30.35
Weekly RBB Set To Challenge Dotted Deuce
On the weekly chart, VIAB is set to challenge the Dotted Deuce at about $34.50 (14%). On the daily chart look between late July and now and you will be able to see two good bullish pops with healthy consolidation. A breakout out of the current consolidation about $30.85 could be the trigger that takes price to one of the swing target zones $34.50. Followed by the next swing target zone about $43.50. There will be minor PBO’s along the way.
Past performance is not indicative of future returns
Good Trading, Rick, and Trading Team
Monthly Trading Results updated the first week of each month
What is Rick is adding to his trade watchlist today? A 246% plus increase in 7 months
can’t be all wrong.
____________________________________________________________
SPY • Hammer Follow Through?
Yesterday a Hammer was painted with the handle bottom working with the 34-EMA for support. At the close, yesterday price action was still in the arms of the seller another lower high and a lower low. If today’s morning futures can stay positive there is a high probability price will challenge the $284.25 area.
The T-Line
We will take a Bullish stance when price closes above the T-Line, this will put price action in the first position with the T-Line supporting below. Watch for the first few price pullbacks for a test and follow through.
Conclusion
The futures are flexing there muscles as I write this blog, anything can happen to be now and the open. Right now it’s up to the buyers to come together and guide price up over the T-Line with a positive close.
****VXX – Let’s not count the VXX out just yet, the price should pull back to the T-Line today. Note the T-Line is still in a baby trend.
Focus Trading Education
Candlesticks • Price Action • T-Line • T-Line Bands • Support • Resistance • Trend • Trendlines • Chart Patterns • Buy Box • Volatility Stops • Profit Zones • Entry Zones • Protective Stops • RBB Rounded Bottom Breakout Strategy • Pop Out of The Box Strategy • Pinball Strategy • Trade Planning, Fibonacci, Stoch/RSI
Subscription Plans • Private 2-Hour Coaching
Testimonial
This is not your usual service that sends out a ton of stock recommendations, and then cherry picks the winners to show you how great they are. Hit and Run Candlesticks and Right Way Options are truly educational services. They taught me how to trade not what to trade. The entire team: Rick, Doug, Steve, and Ed are there to help and answer your questions. They are awesome. They cut years off my learning curve. And it’s a team effort. Everyone in the room (all the members) are there to help with invaluable insights and advice. The only service you will ever need. Thanks to all the team for how you have helped me and for all you do. –Jonathan Bolnick
Rare to have a service teach you how they find their choices but, HRC/RWO teach you how to fish instead of fishing for you. And, your ideas are not panned but shared, implemented, or improved. Sharing is caring. –Thomas Bradly
Past performance is not indicative of future returns
Investing and Trading involve significant financial risk and is not suitable for everyone. No communication from Hit and Run Candlesticks Inc, Right Way Option, Trader Vision 2020 or Rick Saddler, Doug Campbell, Ed Carter, Steve Risner is to be considered financial or trading advice. All information is intended for Educational Purposes Only. Terms of Service.
Rick Saddler, Doug Campbell, Ed Carter, Steve Risner is not a licensed financial adviser nor do they offer trade recommendations or advice to anyone.
Rollercoaster Ride
Rollercoaster Ride
 Another day and another wild rollercoaster ride as the Futures respond sharply higher on the news that the US and China are coming back to the trade negotiation table. Dow Futures currently indicate about a 200 point gap up at the open which will be about 425 points above yesterdays low. Wow, that’s some very difficult volatility to deal with unless you’re a very fast day trader that also happens to trade overnight.
If you’re a swing trader or position trader your, this kind of price action is without question very challenging. Wild swings like this can also inspire poor emotional decision making the and keeping traders off balance. If you don’t feel you have an edge in this wild volatility, then don’t fight it. Step back take a breath and re-engage the market with a clear head when your edge returns.
On the Calendar
We start off Thursday on a dead run with three important market-moving reports at 8:30 AM Eastern. Housing Starts are expecting a decline to 1.271 million in July vs. 1.173 in June with permits rising to a 1.307 million rate. Weekly Jobless Claims expect to continue to show very strong labor demand with a consensus for today of 215,000 wish is 2000 higher than the last reading. Finally, the Philly Fed Business Outlook Survey expects to report a strong 22.5 according to the consensus estimate which seems to be continuously lower than the actual number. We have the Natural Gas Report @ 10:30 AM, 2-Bond Announcements @ 11:00 AM, The Fed Balance Sheet & Money Supply @ 4:30 PM none of which would be expected to move the market.
On the Earnings Calendar, we show 52 companies are scheduled to fess up to their results today. Before the bell, we will hear from JCP, JD, and WMT. After the close AMAT, NVDA & JWN are among those reporting.
Action Plan
Asian markets were lower overnight and appear under stress after making a four-year low. European markets, however, are all showing gains this morning. After another rollercoaster ride yesterday we look to keep the wild price action going with another full overnight reversal at the open. Responding to the report that China and the US are coming back to the trade negotiation table have futures flying high this morning. Currently, the Dow Futures indicate a gap up of near 200 points at the open.
With big morning gaps also comes the possibility of whipsaws so plan your entries carefully and be careful not to chase. Keep in mind, at the open today; the Dow will be about 425 points higher than it was at yesterdays low. Now that’s some wicked volatility to deal with when trying a matain an edge.
Trade Wisely,
Doug
[button_2 color=”green” align=”center” href=”https://youtu.be/cXXPxEXsP74″]Morning Market Prep Video[/button_2]No Blog Thursday
Sorry folks, but I will be out of town in the morning. So there will be no Trader Vision 20/20 Featured Trade Idea Setup and Trade Plan for Thursday.


