Inverted Head and Shoulder On DRIP Swing Trade Idea DRIP Bullish above $6.68

Inverted Head and Shoulder On DRIP

I see an Inverted Head and Shoulder has formed on the S&P Oil and Gas Exploration (ETF) DRIP. Yesterday buyers push price action above the Inverted H&S resistant line. Price and the T-Line have crossed above the 34-EMA and 50-SMA. DRIP has also become an (RBB) Rounded Bottom Breakout pattern. If bought we will look for about $7.30 and $8.25 as possible profit zones. For more details on the DRIP trade, please click the following link. Get the complete details including Fibonacci details TV2020 trade plan right here

Past performance is not indicative of future returns

Good Trading, Rick, and Trading Team

Monthly Trading Results updated the first week of each month

What is Rick is adding to his trade watchlist today? A 246% plus increase in 7 months can’t be all wrong.  $14.00 30-day trial

____________________________________________________________

SPY • It’s Been Bumpy

Yesterday the SPY ran into more bumps causing a new low to close below the T-Line. The recent candle price action (Island Reversal), (Doji Bearish Engulf) shows the buyers have taken a break.

Today Tuesday, August 14, Premarket the futures are up a bit and HD beat on earnings, so the question is, have the buyers come back? First, the resistance of about $284.25 needs to be cleared by the buyers. If weakness continues, we are looking for the $279.40 area as support.

****VXX – The VXX chart is looking for a crack in the ceiling to slip through. The last three days the VXX has attempted a relief rally but stopped by major moving averages and price resistance.

Focus Trading Education

Candlesticks • Price Action • T-Line • T-Line Bands • Support • Resistance • Trend • Trendlines • Chart Patterns • Buy Box • Volatility Stops • Profit Zones • Entry Zones • Protective Stops • RBB Rounded Bottom Breakout Strategy • Pop Out of The Box Strategy • Pinball Strategy • Trade Planning, Fibonacci, Stoch/RSI

Subscription PlansPrivate 2-Hour Coaching

Testimonial

This is not your usual service that sends out a ton of stock recommendations, and then cherry picks the winners to show you how great they are. Hit and Run Candlesticks and Right Way Options are truly educational services. They taught me how to trade not what to trade. The entire team: Rick, Doug, Steve, and Ed are there to help and answer your questions. They are awesome. They cut years off my learning curve. And it’s a team effort. Everyone in the room (all the members) are there to help with invaluable insights and advice. The only service you will ever need. Thanks to all the team for how you have helped me and for all you do. –Jonathan Bolnick

Rare to have a service teach you how they find their choices but, HRC/RWO teach you how to fish instead of fishing for you. And, your ideas are not panned but shared, implemented, or improved. Sharing is caring. –Thomas Bradly


Past performance is not indicative of future returns

Investing and Trading involve significant financial risk and is not suitable for everyone. No communication from Hit and Run Candlesticks Inc, Right Way Option, Trader Vision 2020 or Rick Saddler, Doug Campbell, Ed Carter, Steve Risner is to be considered financial or trading advice. All information is intended for Educational Purposes Only. Terms of Service.

Rick Saddler, Doug Campbell, Ed Carter, Steve Risner is not a licensed financial adviser nor do they offer trade recommendations or advice to anyone.


A Nasty Battle

A Nasty Battle

A Nasty BattleYesterday’s price action turned out to be a nasty battle between the Bulls and Bears with whipsawing leadership several times and likely chopping up accounts.  At the end of the day, the Bears came out victorious leaving behind bearish candle patterns across all 4-major index charts.  Normally that would suggest some follow-through bearishness this morning, but instead, the market seems inclined to serve up another overnight whipsaw.

Asian markets closed mixed and European seem to be following suit, but the US Futures are casting aside Turkish jitters with the US Futures decidedly bullish this morning.  News that an agreement between the US and Mexico is easing trade tensions.  Is this the energy we need to run for new market highs?  Maybe, but remember the lesson given us yesterday; Chasing the open with a fear of missing out can serve up some big losses if the market whipsaws once again.  Carefully plan your approach to the market this morning with that in mind.

On the Calendar

The Economic Calendar gets going early this morning the NFIB Small Business Optimism Index at 6:00 AM Eastern.  Then at 8:30 AM we get the only potential market-moving report with Import and Export Prices.  Forecasters expect import price 0.1 percent higher in July with export prices increasing 0.2 percent in July.  We have Redbook @ 8:55 AM, and two Bond Auctions at 11:30 AM to close the calendar day.

On the Earnings Calendar, we have more than 250 companies reporting earnings today with retail reports as a central theme.  After today the volume or earnings reports drops substantially as the 3rd quarter earnings start to wind down.

Action Plan

I think it’s fair to say that yesterday’s price action was an absolute mess as uncertainty driven whipsaws ruled the day.  Across all 4-indexes daily bearish candles were left behind suggesting a high likelihood of more bearish price action today.  Well, not so much!  It would appear after an announcement that the US and Mexico have come to terms on a new trade agreement all the Turkish jitters have taken a back seat.  Once again Futures began to rally around midnight and have continued to push higher with the Dow currently suggesting a 100 point gap up.  If you feel a twinge of pain from whiplash, you’re not alone as the market continues to be very challenging to trade.

Is this the news we needed for the Bulls to launch to all-time highs in the QQQ’s, SPY and IWM?  Or perhaps could this be just another whipsaw that continues to chop up accounts.  Your guess is as good as mine!  Avoid getting caught up in the opening drama and resist the urge to chase the gap.  If you rushed in yesterday and punished for doing so, don’t repeat the same mistake today.  Fool me once shame on you, fool me twice shame on me.  I for one will wait for the morning rush to pass and stay focused on price action watching for clues of follow-through buying before deciding on any new risk.

Trade Wisely,

Doug

[button_2 color=”green” align=”center” href=”https://youtu.be/ukNViDNmqo0″]Morning Market Prep Video[/button_2]

Turkish Uncertainty

Turkish Uncertainty

Turkish UncertaintyThe market hates uncertainty, and the rapid fluctuations in the Turkish Lira has without question raised some uncertainty.  Banks around the world including many US Banks holding Turkish debit will obviously experience some pressure as the Turkish economy struggles.  Dow Futures have rallied significantly from overnight lows with the bounce off the Lira.  Asian markets closed lower and European markets are also under pressure this morning.

It’s unlikely the fluctuations of the Lira are over so we should expect an increase in volatility as a result.  The VIX bounced sharply on Friday indicating some fear is creeping into the markets.  It will be incumbent on the Bulls to defend key support levels, or we could experience some technical damage in the index charts.  Remain flexible, stay focused on price and be willing to shift if market sentiment begins to shift.

On the Calendar

We kick off the Economic Calendar this week with a very light day.  We have a Bond Announcement at 11:00 AM Eastern.  Then at 11:30 AM we wrap up the day with two Bond Auctions.  I would expect no market reaction.

On the Earnings Calendar, we have just over 140 companies reporting today.  Earnings numbers will begin dropping off this week, but although there will be fewer, we must remain vigilant, checking reports against holdings.

Action Plan

Asian markets were sharply lower overnight, and European markets also lower this morning as the collapsing economy in Turkey reverberates around the world.  Dow Futures were down nearly 200 points around midnight but have since rallied significantly currently pointing to a market open about 75 points lower.  Keep in mind a test of the overnight low would not be out of the question so plan your risk carefully.

Of course, even US Banks are being affected by the Turkish economic issues as they hold significant amounts of the countries debt.  The SPY and DIA indexes have the majority exposure of the exposure to the banks and thus will likely experience some volatility as the Turkish currency fluctuates violently.  Technically both the SPY and QQQ have failed at resistance however if the Bulls step up and defend support levels another push higher is certainly possible.  If prices begin to fail key supports, the Bears could easily take control so keep an eye on price action and prepare for an increase in volatility.

Trade Wisely,

Doug

[button_2 color=”green” align=”center” href=”https://youtu.be/3Nr6u2A94Hc”]Morning Market Prep Video[/button_2]

Pop Out OF the Box Setting Up Trade Idea HMSY

Pop Out OF the Box Setting Up

https://hitandruncandlesticks.com/trading-results/

“If you love what you do you will never work a day in your life”

Pop Out of The Box is setting up on HMSY. HMSY has been trending nicely and a few days ago gapped and as held higher than the gap close. The last four candles have tightened up forming the Pop Out of The Box pattern. The weekly chart looks like a little flag breakout with a Doji continuation pattern. Note the daily and hourly charts are closed Friday above the V-Stop but the 15 min closed below the V-Stop. Let’s stay on our toes this week, keep losses small and take profits into strength. We have added a few shorts to our watch list. For more details on the HMSY trade, please click the following link. Get the complete details including Fibonacci details TV2020 trade plan right here


Past performance is not indicative of future returns

Good Trading, Rick, and Trading Team

Monthly Trading Results updated the first week of each month

Subscription Plans  What is Rick is adding to his trade watchlist today? A 246% plus increase in 7 months can’t be all wrong.  

____________________________________________________________

SPY • A State of Rest

Friday we saw a little market weakness with the SPY dropping $1.91 and closing below the T-Line putting the short term trend negative. On the Bright side price did close above the 20-SMA. If the buyers fail to find support near the 20-SMA the 34-EMA and August low $279.40 are in the crosshairs. (VT) Total world Stock ETF has dropped below $75.20; this warrants extreme caution for the bull. I consider VT being below $75.20 and huge clue if we start to see the SPY break trend we will move money into a few shorts.

****VXX – The VXX gapped up and closed above the T-Line on strong volume, I suspect we could see a challenge of $32.50 this week. Bulls are cautious.

Focus Trading Education

Candlesticks • Price Action • T-Line • T-Line Bands • Support • Resistance • Trend • Trendlines • Chart Patterns • Buy Box • Volatility Stops • Profit Zones • Entry Zones • Protective Stops • RBB Rounded Bottom Breakout Strategy • Pop Out of The Box Strategy • Pinball Strategy • Trade Planning, Fibonacci, Stoch/RSI

Subscription PlansPrivate 2-Hour Coaching

Testimonial

This is not your usual service that sends out a ton of stock recommendations, and then cherry picks the winners to show you how great they are. Hit and Run Candlesticks and Right Way Options are truly educational services. They taught me how to trade not what to trade. The entire team: Rick, Doug, Steve, and Ed are there to help and answer your questions. They are awesome. They cut years off my learning curve. And it’s a team effort. Everyone in the room (all the members) are there to help with invaluable insights and advice. The only service you will ever need. Thanks to all the team for how you have helped me and for all you do. –Jonathan Bolnick

Rare to have a service teach you how they find their choices but, HRC/RWO teach you how to fish instead of fishing for you. And, your ideas are not panned but shared, implemented, or improved. Sharing is caring. –Thomas Bradly


Past performance is not indicative of future returns

Investing and Trading involve significant financial risk and is not suitable for everyone. No communication from Hit and Run Candlesticks Inc, Right Way Option, Trader Vision 2020 or Rick Saddler, Doug Campbell, Ed Carter, Steve Risner is to be considered financial or trading advice. All information is intended for Educational Purposes Only. Terms of Service.

Rick Saddler, Doug Campbell, Ed Carter, Steve Risner is not a licensed financial adviser nor do they offer trade recommendations or advice to anyone.


HMSY Setup and Trade Plan

Today’s Featured Trade Idea is HMSY.

Members can hear Rick’s detailed review in the trading room at 9:10am Eastern.  For now, here is my analysis and a potential trade plan made using our Trader Vision 20/20 software.

HMSY printed a Bullish Engulfing signal on Friday within a tight consolidation after a strong Bull run.  I will be looking for confirmation on Monday using the $29.96 Support level to protect my Stop and using the convergence of Weekly S/R levels with Fib Extensions (of the recent Bull run) as my Targets.

Trader Vision shows us that earnings are out of the way. It also tells us we have 6 Bullish conditions versus No Bearish conditions for this setup.

TV20/20 also shows us that we can achieve our Trade Goal even before reaching the 1st Target price. If we make that first Target, we can get over a 5:1 Reward/Risk. However, if we sell half and hold the rest until Target #2, we can achieve a 6.33:1 Reward/Risk ($475 profit).

Having this knowledge before a trade is even entered makes it much easier to control emotions and maintain discipline.

Below is my markup of the chart and the trade plan as laid out by Trader Vision 20/20.  As a bonus, if you click the green button below, you’ll be able to watch a video of the chart markup and trade planning process.

The HMSY Trade Setup – As of 8-10-18

HMSY Chart Setup as of 8-10-18

The Trade Plan

HMSY Trade Plan for 8-13-18

Note how Trader Vision 20/20 does so much of the work for you.  Knowing the ratio of Bullish Conditions to Bearish ones as well as the overall risk of the position size, risk to Stop out and the Reward possible at each Target price can help a great deal with controlling our emotions.  Knowing the dollar impact of every scenario ahead of time, allows us to make calm decisions during the trade.  It really takes the pressure off.  No guesswork.  No surprises.  No emotional roller coaster.

To see a short video of this trade’s chart markup and trade planning, click the button below.


[button_2 color=”light-green” align=”center” href=”https://youtu.be/zzBrTtpg77c” new_window=”Y”]Trade Plan Video[/button_2]


Put the power to Trader Vision 20/20 to work for you…

[button_2 color=”orange” align=”center” href=”https://hitandruncandlesticks.com/product/trader-vision-20-20-monthly-subscription2/” new_window=”Y”]TV20/20 Software[/button_2]


Testimonial

Trader Vision immediately simplified the process…immediately it provided that information and guidance to me. I knew what I would risk for how much reward, I began taking trades off at the 1st target, 2nd target, I was no longer holding all my trades for the homerun. I also began implementing the stop losses if and when they were reached, not just hoping the stock would recover.  It then became easier to see what patterns were working for me and which were not.  It provided a much more relaxed and stress-free environment. –Joan G


***************************************************************************************************

Investing and Trading involve significant financial risk and are not suitable for everyone. Ed Carter is not a licensed financial adviser nor does he offer trade recommendations or investment advice to anyone. No communication from Hit and Run Candlesticks Inc. is to be considered financial or trading advice. All information is intended for Educational Purposes Only. Terms of Service.

***************************************************************************************************

er nor does he offer trade recommendations or investment advice to anyone. No communication from Hit and Run Candlesticks Inc. is to be considered financial or trading advice. All information is intended for Educational Purposes Only. Terms of Service.

***************************************************************************************************
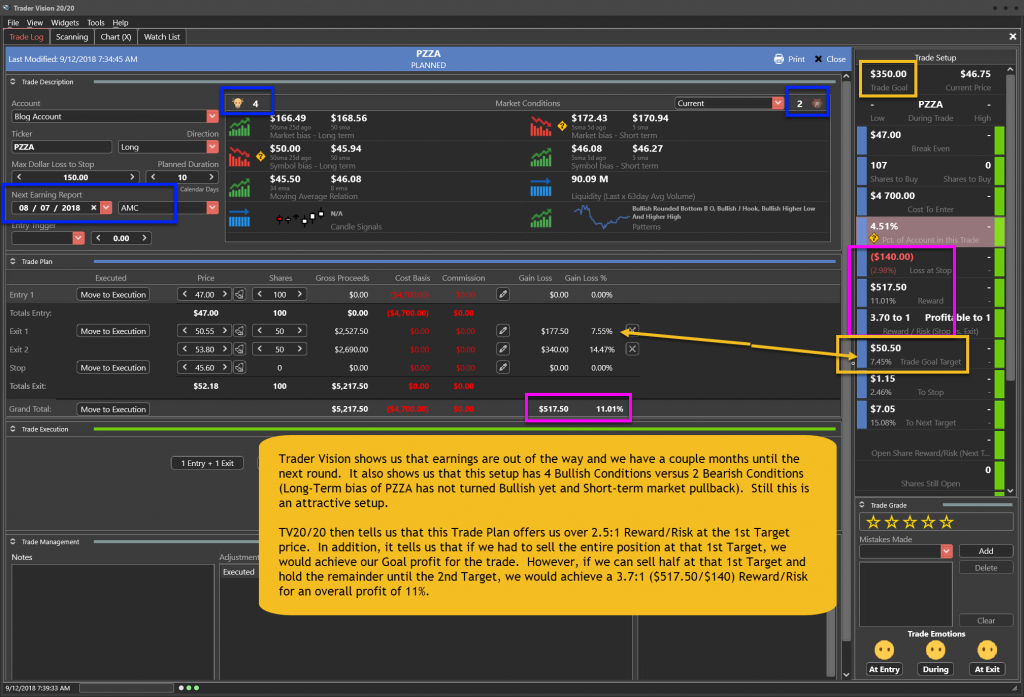
FNSR Setup and Trade Plan

Today’s Featured Trade Idea is FNSR.

Members can hear Rick’s detailed review in the trading room at 9:10am Eastern.  For now, here is my analysis and a potential trade plan made using our Trader Vision 20/20 software.

FNSR broke through the 200sma and printed a Bullish Engulfing signal on Thursday. I’ll be looking for follow-through to break the July high Resistance level (also longer-term Weekly level) with Targets based off the Weekly S/R levels above. Remember this is Friday, so we have 2 additional days of headline risk, but I like this chart and on follow-through will be taking a position.

Trader Vision tells us we have a month until earnings. It also shows that we have 6 Bullish conditions (should be 7 with the Bull Engulf signal) and no Bearish conditions in favor of this trade.

TV20/20 then shows us that this plan offers over 2:1 Reward/Risk to the first Target and over 3:1 Reward/Risk if we can sell half at the first Target and the rest at the 2nd Target. Overall, this would give us a 11.64% profit ($440) and easily make our Trade Goal. In fact, TV20/20 tells us we can make that goal if FNSR reaches $20.65.

Having this knowledge before a trade is even entered makes it much easier to control emotions and maintain discipline.

Below is my markup of the chart and the trade plan as laid out by Trader Vision 20/20.  As a bonus, if you click the green button below, you’ll be able to watch a video of the chart markup and trade planning process.

The FNSR Trade Setup – As of 8-9-18

FNSR Chart Setup as of 8-10-18

The Trade Plan

FNSR Trade for Plan 8-10-18

Note how Trader Vision 20/20 does so much of the work for you.  Knowing the ratio of Bullish Conditions to Bearish ones as well as the overall risk of the position size, risk to Stop out and the Reward possible at each Target price can help a great deal with controlling our emotions.  Knowing the dollar impact of every scenario ahead of time, allows us to make calm decisions during the trade.  It really takes the pressure off.  No guesswork.  No surprises.  No emotional roller coaster.

To see a short video of this trade’s chart markup and trade planning, click the button below.


[button_2 color=”light-green” align=”center” href=”https://youtu.be/xmpz2MBDv4g” new_window=”Y”]Trade Plan Video[/button_2]


Put the power to Trader Vision 20/20 to work for you…

[button_2 color=”orange” align=”center” href=”https://hitandruncandlesticks.com/product/trader-vision-20-20-monthly-subscription2/” new_window=”Y”]TV20/20 Software[/button_2]


Testimonial

Trader Vision immediately simplified the process…immediately it provided that information and guidance to me. I knew what I would risk for how much reward, I began taking trades off at the 1st target, 2nd target, I was no longer holding all my trades for the homerun. I also began implementing the stop losses if and when they were reached, not just hoping the stock would recover.  It then became easier to see what patterns were working for me and which were not.  It provided a much more relaxed and stress-free environment. –Joan G


***************************************************************************************************

Investing and Trading involve significant financial risk and are not suitable for everyone. Ed Carter is not a licensed financial adviser nor does he offer trade recommendations or investment advice to anyone. No communication from Hit and Run Candlesticks Inc. is to be considered financial or trading advice. All information is intended for Educational Purposes Only. Terms of Service.

***************************************************************************************************
er nor does he offer trade recommendations or investment advice to anyone. No communication from Hit and Run Candlesticks Inc. is to be considered financial or trading advice. All information is intended for Educational Purposes Only. Terms of Service.

***************************************************************************************************
Manage Your Inventory Like You Own It

Manage Your Inventory Like You Own It

https://hitandruncandlesticks.com/trading-results/

Love trade and profit

Manage your inventory like you own it. There are times when selling a loser is the best trade of the day. Sometimes you have to move your inventory around. Knowing when to close a profitable position or knowing when to peel off a few profits and allow the smaller position to work. Inventory management is not about profit on every trade; inventory management is about making business decisions. Are you making the best business decision or one on one personal trade decisions?

Looks like the sellers are pushing price lower this morning to test the T-Line and possibly more. Yesterday before the close we did buy an IWM Put and a VXX Call.

Trading Results

Our “Road to Wealth” Account Statement is posted on the website for you to see and follow. 2018 YTD (Through) July) +246% See for your self. Want to learn more about how Rick Saddler does it?

Workshops

Trends with Benefits Learn More

Fibonacci Retracements & Extensions Learn More

Road Trip with Continuation Patterns Learn More

Sharpen Your Edge with Stochastics/RSI Learn More


HRC Trading Tools I Use

Every Day ChartingTC2000

Trade Planning Trader Vision 2020


Trading platform and Brokerage

Trading Platform – TradeHawk

Brokerage – Tradier

Stock Only Trades – Flat $16.00 per month

Stock and Option Trades – Flat $159.00 per month

Contact Us if you have questions

Membership ServicesPrivate 2-Hour Coaching


Past Performance Is No Guarantee of Future Results

Investing and Trading involve significant financial risk and is not suitable for everyone. No communication from Hit and Run Candlesticks Inc, Right Way Option, Trader Vision 2020 or Rick Saddler, Doug Campbell, Ed Carter, Steve Risner is to be considered financial or trading advice. All information is intended for Educational Purposes Only. Terms of Service.

Rick Saddler, Doug Campbell, Ed Carter, Steve Risner is not a licensed financial adviser nor does he offer trade recommendations or advice to anyone.

*************************************************************************************


Price is King

Price is King

With all our technology, designer scans and flashy indicators, there is one undeniable truth; Price is King.  Traders will spend years trying to find the perfect combination of indicators and write complicated scans in a constant search for the holy grail.  I’m no different and have to confess I wasted years on that quest. It was not until I became a student of price that I finally began to experience real account growth.

The simple concepts of price support, price resistance, and trend often get ignored as traders focus only on their indicators.  Remember indicators don’t pay you!  It’s only when price moves we can get paid.  The last few days I have suggested caution and to be careful not to over-trade.  Not because I want to see the market pullback but because of price action and price resistance was telling us to be cautious.  Price is King and will provide the clues for better trading results if we become students of price.

On the Calendar

Friday begins with the potential market-moving CPI Report at 8:30 AM Eastern.  Forecasters expect the CPI to rise 0.2 percent with the year-on-year coming in unchanged at 2.9 percent and the core rate at 2.3 percent.  The Baker-Hughes Rig Count is a 1:00 PM and the Treasury Budget closes the day at 2:00 PM.  Consensus for July is for a monthly deficit of 73.5 with both spending and tax receipts on the rise.

On the Earnings Calendar, we finally get a little break with only 46 companies reporting earnings today.  Although the bulk of earnings reports this season are now behind us, we still have more than 400 on the calendar for next week so keep checking those earnings dates.

Action Plan

Although hopeful the Bulls could push us resistance levels yesterday, the Bears gained a slight upper hand by the close.  Durning the night Asian market were mixed but mostly lower and Europian markets are currently lower across the board.  As a result, the Dow futures are currently pointing to a gap down of nearly 100 points as I write this.  At least, for now, it would seem that resistance has done its job but let’s not count the Bulls out just yet.  A light pullback could be all that’s needed for the Bulls to gather energy and reinforcements to mount an attack on the highs.

As the weekend approaches, keep in mind, that the trade tensions between the US and China continue to grow.  Carefully consider how much risk you’re carrying into next week with that in mind.  There is a very good chance I will trim some positions and take some profits as take my normal trip to the bank on Friday.  I wish you all a fantastic weekend.

Trade Wisely,

Doug

[button_2 color=”green” align=”center” href=”https://youtu.be/8wyN13oTCc8″]Morning Market Prep Video[/button_2]

Riddle me this.

Riddle me this.

RiddleThe market is currently presenting us with a difficult riddle.  The Bulls and Bears appear equally matched as the indexes hover just below price resistance levels and record highs.  Yesterday the Bears had an open invitation to push lower but lacked the conviction to get it done.  On the other hand, the Bulls showed a willingness to defend current levels but also lacked the conviction to move up to test resistance.  The riddle becomes even more complex with the current futures suggesting a flat open.

Should we buy hoping for a breakout or would it be better to take some profits and avoid adding additional risk?  Indeed a difficult riddle for traders to resolve.  My personal choice is to remain cautious and closely watch price action for directional clues.  I will avoid adding risk this close to price resistance but have a watchlist of good stocks ready to go if the bulls show some conviction.  If by chance the Bears attack I have profits locked with stop orders and ready to pick up some negative delta if necessary.

On the Calendar

Jobless Claims and PPI top the Economic Calendar today with both released at 8:30 AM Eastern time.  According to consensus estimates the weekly Jobless Claims expect an increase to 220,000 vs. last weeks 218,000 but remains near historic lows.  The PPI consensus is for a 0.3 percent monthly increase but exclude food, energy, trade services, and they forecast a 0.2 percent increase.  We have a Fed Speaker @ 9:30 AM, Wholesale Trade @ 10:00 AM, the Natural Gas Report at 10:30 AM, 4-Bond events 11:00 AM and 1:00 PM, with the Fed Balance Sheet & Money Supply closing the calendar day at 4:30 PM.

Today we have another big day of earnings with more than 380 companies fessing up to their results.  There are still a lot of companies yet to report this quarter but today marks the last of the very big day of reports this earnings season.

Action Plan

The Bears had an opportunity yesterday to move the market lower, but the Bulls dug in and showed a willingness to defend back.  As good as that was to see, sadly the Bulls lacked the energy required to be very convincing.  With the exception of the QQQ which managed a 0.12 increase the rest of the indexes finished the day slightly lower leaving us with more question than answers.

The Bulls defending this close to resistance levels and record highs in the QQQ and SPY suggests a desire to move higher.  However, their lack of conviction keeps alive the concern that the resistance above could be stronger than there desire.  Currently, the futures suggest a flat open which is not helping with this conundrum.  Long story short we need remain cautious this close to resistance levels and stay focused on price action.

Trade Wisley,

Doug

[button_2 color=”green” align=”center” href=”https://youtu.be/EwMnBItPx0E”]Morning Market Prep Video[/button_2]