Negative Territory
 Another nasty day of selling in the tech sector, breaking below Octobers low, and lead the overall market into negative territory for the year. On the positive side the DIA, SPY, and IWM managed to hold at the support of Octobers low, but there is so much technical damage in the charts its difficult to call that victory. Both the QQQ and the SPY are at risk of joining the IWM with their 50-day averages crossing below the 200-day averages in the very near future. The so-called death cross.
Yesterday before the market had even closed there were traders predicting this is the bottom. Really? Yes, this could be a bottom, and this morning we are getting a nice oversold bounce but consider the fact it may be just a resting point before resuming the downtrend. See the price action for what it is not for what you want it to be! Gamble and you may win, but you have an equal chance of just providing liquidity. Remember volume is likely to decline sharply after the morning rush so plans your risk into the holiday carefully! I wish you all the very best and Happy Thanksgiving.
On the Calendar
On the Earnings Calendar, we have less than 40 companies reporting earnings as we head into the holiday. Notable reports today are ADSK, BILI, BJ, BZUN, CPRT, DE, FL, GPS, KEYS, SE.
Action Plan
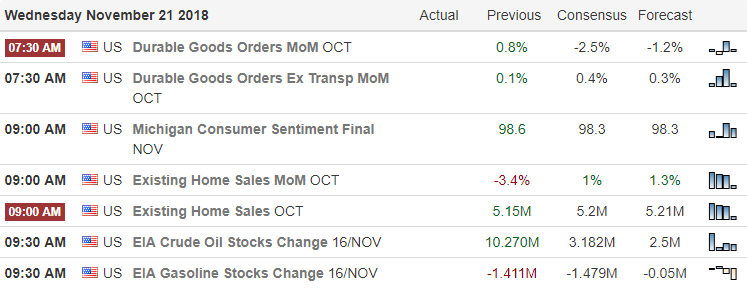
After yesterdays nasty gap down and selloff, the indices are once again in negative territory for the year. Now the question is will the October lows hold as the price support for the DIA, SPY, and IWM? The QQQ’s yesterday broke support creating yet another layer of resistance as the tech sector continues to slide lower. This morning futures are suggesting a bounce this morning, and I’m already seeing traders trying to predict that this is the bottom.
After sliding 1000 points in just two days, it might be wise to consider that this mornings rally is merely a short-term oversold rally! Sure you could gamble and win but its still a straight up gamble nothing more! We have a very busy economic calendar this morning and some important earnings reports, but after the morning rush volume is likely to drop quickly as traders head out for their holiday plans. I want to wish every one of you a very Happy Thanksgiving!
Trade Wisely,
Doug
[button_2 color=”green” align=”center” href=”https://youtu.be/QlWMHLIWkiY”]Morning Market Prep Video[/button_2]
Gap Spinning Top Doji
Yesterday we saw the SPY gap down and closed with a Spinning Top Doji. I don’t subscribe to the idea of a Doji being a buy signal as many do, I do believe the Doji represents indecision, a time for rest, re-think direction. $270.60 is about 50% of the recent low and recent high making it an important horizontal line to have on a chart. Sellers are still in control and can be easily seen by adding a downtrend line to the tops of price action. It has been my experience more money can be made by trading with the trend, not against the trend and to have patience when you think the trend is turning.
 Thanksgiving Week Trade Ideas
With this being a holiday week low market volume, Thursday market closed and Friday a half day I have decided to suspend any new trade ideas until Monday. We will post trade ideas as they appear on LTA-Live Trading Alerts Real Time Market Scanner in the trading room.
_______________________________________________________
Trading Services We Offer
- Hit and Run Candlesticks
- Right Way Options
- Top Gun Day Trading
- 30-Day Trial
321% This Year
The two most important pieces of software Rick uses is LTA – Live Trading Alerts Get your 30-Day Trial, and TC2000 Charting Receive $25.00 Off
Rick has dialed them in for max performance, and he freely shares his insights on what makes the tools the best and how to use them. Rick is also one of the only traders in the industry that shares his trading account. Traspaerancey and Trading Results.
Free YouTube Education • Subscription Plans • Private 2-Hour Coaching
YouTube Videos
Trading at the Beach • How to set up the T-Line Regression Lines • MetaStock Automated • Trading the T-Line Trap • Shorting the Blue Ice Pattern
DISCLAIMER: Investing / Trading involves significant financial risk and is not suitable for everyone. No communication from us should be considered as financial or trading advice. All information provided by Hit and Run Candlesticks Inc, its affiliates or representatives is intended for educational purposes only. You are advised to test any new approach before implementing it. Past performance does not guarantee future results. Terms of Service
QQQ
 Yesterday as I evaluated the index charts I mentioned my biggest concern was the vulnerability of the QQQ chart and its ability to drag the market lower. Unfortunately, with the WSJ reporting fresh concerns about FB leadership and AAPL cutting production of its new iPhone’s, the QQQ’s broke support as the tech index tumbled 3.25%.
Asian markets follow the US lower overnight, and European markets are lower across the board this morning. As a result, US Futures indicate a substantial gap down with the QQQ set to test Octobers low at the open. As the holiday approaches volumes are very likely to decline after Wednesday’s open so plan your risk carefully and remember cash is a position!
On the Calendar
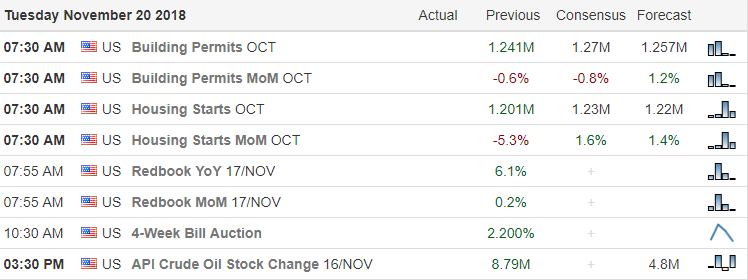
On the Earnings Calendar, we nearly 60 companies reporting earnings today. Notables include A, ADI, BBY, BECN, CPB, HRL, INTU, JEC, KSS, LB, LOW, MDT, NUAN, PSTG, ROST, SFL, TGT, TJX, URBN.
Action Plan
My concern about the QQQ chart became a reality yesterday with new that AAPL has slashed production of its new iPhone’s and more concerns about FB leadership surfaced. The NASDAQ broke support sliding 3.25% dragging the rest of the market lower as it declined. Now a test of the October low and possibly lower seems inevitable for the QQQ. Currently, the US Futures indicate sharp declines at the open as the technical damage in the charts continues to grow.
Historically the influence of Santa should begin, but those eight little reindeer have to battle a tremendous headwind this year. Asian markets were sharply lower overnight, and currently European are down across the board. As bearish as all that sounds be careful not to chase short positions near support with a gap down open. Wait to make sure there are follow-through sellers supporting the gap. At this time the VIX is indicating fear, but if the market breaks to new lows, we will have to watch for signs of panic selling. Keep in mind volume will likely decrease substantially on Wednesday so plan your risk carefully as we head into the holiday.
Trade Wisely,
Doug
[button_2 color=”green” align=”center” href=”https://youtu.be/LESUEzKiE0I”]Morning Market Prep Video[/button_2]
November 15 Lows Hold For Now?
The SPY slide yesterday but held above the November 15 lows for now. I am not boosting that is fantastic or anything just simply an observation. The bulls are getting their butts kicked as they try to fight back. Until we have a winner, this will be a troubled market to trade. I have fewer positions on and less invested in lowering my risk exposure. The SPY weekly chart is hanging from the 50-SMA, and that is never good. If the bulls can’t find a way to get back above the 50-SMA price action will need to find friendly support and the $246.00 area could be the story.
The first step for the bulls is to find a reason to find support above $270.50, then $275.90 and lastly (for now) $281.15. Below $270.50 the sellers will work for $265.30 and $260.00
Thanksgiving Week Trade Ideas
With this being a holiday week low market volume, Thursday market closed and Friday a half day I have decided to suspend any new trade ideas until Monday. We will post trade ideas as they appear on LTA-Live Trading Alerts Real Time Market Scanner in the trading room.
_______________________________________________________
Trading Room Services
- Hit and Run Candlesticks
- Right Way Options
- Top Gun Day Trading
- 30-Day Trial
321% This Year
The two most important pieces of software Rick uses is LTA – Live Trading Alerts Get your 30-Day Trial, and TC2000 Charting Receive $25.00 Off
Rick has dialed them in for max performance, and he freely shares his insights on what makes the tools the best and how to use them. Rick is also one of the only traders in the industry that shares his trading account. Traspaerancey and Trading Results.
Free YouTube Education • Subscription Plans • Private 2-Hour Coaching
YouTube Videos
Trading at the Beach • How to set up the T-Line Regression Lines • MetaStock Automated • Trading the T-Line Trap • Shorting the Blue Ice Pattern
DISCLAIMER: Investing / Trading involves significant financial risk and is not suitable for everyone. No communication from us should be considered as financial or trading advice. All information provided by Hit and Run Candlesticks Inc, its affiliates or representatives is intended for educational purposes only. You are advised to test any new approach before implementing it. Past performance does not guarantee future results. Terms of Service
Happy Thanksgiving Week
Happy Thanks Giving Week. This week will be a challenge for sure with Tuesday getting ready for Thanksgiving, Wednesday Thanksgiving Day, Thursday the day after Thanksgiving. Friday is Black Friday, and the market is open ½ day, then teres Cyber Monday. The volume in the markets will likely dry up to near dust. In the trading room today we will look at my dark chart with no candles or price action, moving averages only. You will see the trouble the bulls are fighting. The 34-EMA is barely hovering over the 200-SMA, and the 50-SMA started to turn down in early October. Under $275.85 the bulls are sitting ducks and could be forced to test the November possible the October lows. 7:30 am SPY futures down 10.00 and DIA down 85.00
FEYE On The Watchlist
FEYE is on the watchlist because of the trend, and the possible follow through freon the current chart pattern. Bullish trend. Volume break on October 31, and now price is having around supporting about $17.90. Thursday and Friday showed buyer interest near the Volatility Stop. Over $18.80 probable test of $19.50. Over $19.50 probable teat of near the recent high, so on and so on.
Add FEYE to your LTA-Live Trading Alerts Real Time Market Scanner watchlist and be alerted for a bullish entry/trade. Members trade ideas will be on the member’s blog.
Trading Services We Offer
- Hit and Run Candlesticks
- Right Way Options
- Top Gun Day Trading
- 30-Day Trial
321% This Year
The two most important pieces of software Rick uses is LTA – Live Trading Alerts Get your 30-Day Trail and TC2000 Charting Recieve $25.00 Off
Rick has dialed them in for max performance, and he freely shares his insights on what makes the tools the best and how to use them. Rick is also one of the only traders in the industry that shares his trading account. Traspaerancey and Trading Results.
Free YouTube Education • Subscription Plans • Private 2-Hour Coaching
YouTube Videos
Trading at the Beach • How to set up the T-Line Regression Lines • MetaStock Automated • Trading the T-Line Trap • Shorting the Blue Ice Pattern
DISCLAIMER: Investing / Trading involves significant financial risk and is not suitable for everyone. No communication from us should be considered as financial or trading advice. All information provided by Hit and Run Candlesticks Inc, its affiliates or representatives is intended for educational purposes only. You are advised to test any new approach before implementing it. Past performance does not guarantee future results. Terms of Service
Choppy Holiday Price Action
 Thanksgiving vacations, Black Friday and Cyber Monday typically set the stage for choppy holiday price action. There are a lot of good-looking charts showing up after the rally relief last Thursday and Friday, but as the holiday nears they may find it difficult to find the energy follow-through. Of course, news such as a China trade deal would be a game changer but short of something like that this could be a challenging week.
You may have to very flexible and nimble willing to taking profits and cutting losers quickly. After the morning rush on Wednesday expect volume to drop like a rock unless driven by a surprise new event. Expect choppy price action on the half day of Black Friday trading and the Cyber Monday holiday sales events. If you’re heading out early for your holiday plans, I want to wish you safe travel and a very Happy Thanksgiving!
On the Calendar
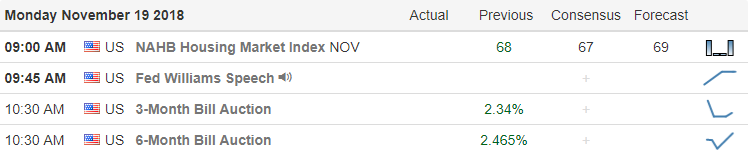
There are 66 companies reporting earnings today. Notables today are AABA and JD which both report before the bell this morning.
Action Plan
Major holidays weeks typically see a significant decline in volume adding an additional challenge to our trading. We may find plenty of good long and short entry signals, but they may lack the energy to follow-through and profit. Thursday the market is closed, and Friday it’s only open half a day. In the past, both Black Friday and Cyber Monday are also light volume days with everyone focuses on the holiday shopping deals and travel.
Futures are suggesting a slightly bearish open with the Dow currently indicated to gap down about 75 points. Asian and European markets were bullish overnight. Because of the risks of holding over a holiday weekend, if I do trade, I will plan to take profits quickly and cut losers without mercy. I intend to be light in my portfolio on swing trades by Wednesday and will most likely stay that way until next week. If the holiday sales events go well then perhaps Santa can begin working his magic by next week. If sales disappoint, then watch the emergence of the Grinch.
Trade Wisely,
Doug
[button_2 color=”green” align=”center” href=”https://youtu.be/FvpgiSvf5gk”]Morning Market Prep Video[/button_2]


