Wall of Worry Powell Trump China
The Powell, Trump, China wall of worry are a few of the troubles the market is dealing with. Powell to speak today and the upcoming Fed meeting Dec. 19 may shed positive light or lay a dark cloud over the market. The G20, Trump and China meeting might remove some of the walls of worry or add more. The technical fracture the market is also a problem and will take time to resolve.
Another positive day yesterday for the SPY, about $273.25 remains the number the bulls need to beat before they can advance. Above $265.45 keeps the bull from drowning but struggling.
BABA RBB Setup
We are already long BABA
BABA has been flirting the RBB set up with price closing over the 50-SMA the past 2-days. The bottom construction looks solid with an Inverted Head and Shoulder formation. The weekly chart found support on the Dotted Duece and has now closed back above the weekly T-Line. The typical RBB trade target direction is the 200-SMA. BABA has been added as a trade candidate to add to our LTA-Live Trading Alerts Real Time Market Scanner watchlist for a buying alert. BABA bullish above $156.502, stop below $147.65
Members, please log in to the member’s blog for more Trade-Ideas. Start here for membership or a trial
****VXX – Bring the VXX down, bring the fear down
Trading Services We Offer
- Hit and Run Candlesticks
- Right Way Options
- Top Gun Day Trading
- 30-Day Trial
321% This Year
Rick uses three main trading tools and has dialed them in for max performance. Rick also freely shares his insights on what makes the tools the best and how to use them. Rick is also one of the only traders in the industry that shares his trading account. Traspaerancey and Trading Results.
- LTA – Live Trading Alerts Get your 30-Day Trail
- TC2000 Charting Get $25.00 Off
Free YouTube Education • Subscription Plans • Private 2-Hour Coaching
YouTube Videos
Trading at the Beach • How to set up the T-Line Regression Lines • MetaStock Automated • Trading the T-Line Trap • Shorting the Blue Ice Pattern
DISCLAIMER: Investing / Trading involves significant financial risk and is not suitable for everyone. No communication from us should be considered as financial or trading advice. All information provided by Hit and Run Candlesticks Inc, its affiliates or representatives is intended for educational purposes only. You are advised to test any new approach before implementing it. Past performance does not guarantee future results. Terms of Service
Follow-Through?
 After the big gap and rally yesterday I was hoping for a little follow-through today, but a little profit taking would not be that unusual. So far this morning presidential trade war threats have trumped the record-breaking Cyber Monday sales event. (pun intended) As a result, AAPL is under a little pressure this morning as the hits keep on coming for the battered tech sector.
If the Bulls can defend yesterday’s low in the QQQ’s, then the strong holiday sales should extend the relief rally. However, if the Bears are allowed to breach yesterday’s index lows fear could easily win the day, and a retest of last Tuesdays low would not be out of the question. Volume should return of the next few days so be patient, disciplined and focused on price action. We all want to see the market recover but what we want is not important. See the chart for what it is not as we want it to be!
On the Calendar
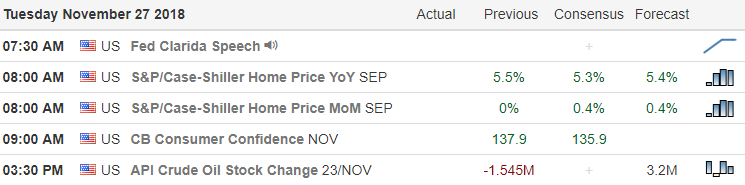
On the Earnings Calendar, we have 33 companies reporting result today.
Action Plan
The online shoppers worked hard all day yesterday increasing yesterdays Cyber Monday sales by nearly 20% over last year and setting new records. Now that the Thanksgiving shopping events are over and vacations ending volume should begin to return over the next couple of days. Unfortunately, futures are pointing to modest gap down this morning with the president threatening tariffs on all imported iPhone’s from China. Consequently, AAPL is under a little pressure this morning putting even more pressure on the already vulnerable tech sector.
After such a big rally yesterday some profit taking would be normal but if the sellers breach yesterday’s low a retest of last Tuesday’s could be possible. However, if the bulls can defend yesterday’s low’s then a move higher to test resistance seems likely assuming trade war rhetoric doesn’t get in the way. Be patient, flexible and focused on price action without bias, remembering there is no need to rush to a trade. The volume will return, but I would not be at all surprised if it does so slowly over the next few days.
Trade Wisely,
Doug
[button_2 color=”green” align=”center” href=”https://youtu.be/MzLIP5wzzVc”]Morning Market Prep Video[/button_2]
SPY 2-Day Chart Printed Bullish Engulf
The good news: The SPY 2-day chart has printed a double bottom Bullish Engulf all on the 200-SMA. So is this the start of a bullish turnaround? The answer is in whether or not we have bullish follow through over the first hurdle $273.25. The bad news is the SPY like the other indices are in a painful downtrend with a ton of resistance above. Trade considerations and rate hikes continue to add bearish weight to this market. Smaller and fewer positions and quicker profits seem to be the key in this market.
TAL RBB Setup
TAL is an (RBB) Rounded Bottom Breakout Setup and finding support on one of our lower band lines. In the last few weeks price has rallied up and rested with a Flag formation. The rule of thumb is that on a breakout price should move to the next resistance level. The typical RBB trade target direction is the 200-SMA. Adding TAL as a trade candidate to add to our LTA-Live Trading Alerts Real Time Market Scanner watchlist for a buying alert. TAL bullish above $29.15, stop below $27.75
****VXX – Yesterday the VXX chart shows that a little fear was leaving the party. Be careful this party can start up again at any time.
321% This Year
Rick uses three main trading tools and has dialed them in for max performance. Rick also freely shares his insights on what makes the tools the best and how to use them. Rick is also one of the only traders in the industry that shares his trading account. Traspaerancey and Trading Results.
Free YouTube Education • Subscription Plans • Private 2-Hour Coaching
YouTube Videos
Trading at the Beach • How to set up the T-Line Regression Lines • MetaStock Automated • Trading the T-Line Trap • Shorting the Blue Ice Pattern
DISCLAIMER: Investing / Trading involves significant financial risk and is not suitable for everyone. No communication from us should be considered as financial or trading advice. All information provided by Hit and Run Candlesticks Inc, its affiliates or representatives is intended for educational purposes only. You are advised to test any new approach before implementing it. Past performance does not guarantee future results. Terms of Service
Record-Breaking Holiday
 It would seem the record-breaking holiday spending is bringing out a wave of bulls this morning squeezing the bears that held short positions over the weekend. The Dow is currently expected to gap up nearly 250 points. As nice as is to see some relief in the selling be careful not to get caught up in the morning hype chasing into the gap. First, consider that volume has the potential of being light today as many traders extend vacations and that the Cyber Monday sales event will attract a lot of attention away from the market.
Secondly, keep in mind that one day does not make a trend and that all the index charts have significant price resistance levels above. While it’s true, this could be the beginning of a Santa Claus rally it could also be nothing more than a pop and drop unless we see real buyers stepping in to support the gap after the open. If you happen to be in long positions, then remember that gaps are gifts, consider taking some profits. If, like me, your mostly flat this morning then we have already missed the move which means there is no need to rush. Maintain, your discipline, don’t chase and wait for the next entry that provides you an edge.
On the Calendar
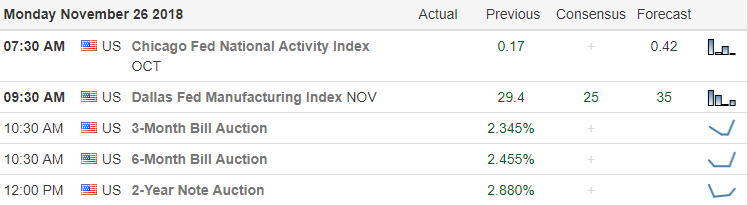
We have 42 companies on the Earnings Calendar expected to report results this Cyber Monday to keep us on our toes.
Action Plan
The bulls seem very inspired today as holiday shopping blows past all previous records and its far from over. The estimates for today’s so-called Cyber Money sales event is expected break records as well with more than 7 billion in online sales with the vast majority coming from mobile devices. It would seem shopping from the phone has now become the preferred method of holiday shoppers.
As I write this the Dow futures are pointing to a gap up of more than 250 points. Anyone caught short will most certainly experience the pain of a short squeeze this morning. With the nasty winter storm that swept across the central US, travelers found themselves trapped at the airport as 1000’s of flights canceled. Combine extended vacations, travel issues and Cyber Monday I would be very careful about chasing into this mornings pop until we see buyers stepping up to support the gap. It’s entirely possible that volume could be light today after the morning rush so keep a very close eye and price action. As nice as it is to see a relief rally keep in mind the indexes have significant resistance levels above which means a pop and drop day is not out of the realm of possibility.
Trade Wisely,
Doug
[button_2 color=”green” align=”center” href=”https://youtu.be/bjSg4ZQo0wY”]Morning Market Prep Video[/button_2]
SP-500 Set To Open Higher
The SP-500 is set to open higher this morning and the DJ-30 set with a triple-digit open, but the big question is this the start of a bullish turnaround? To be a bullish turnaround, we would need to see a bullish bottom constructed and price above $271.90 on the SPY. On the other hand, a good bullish bounce would make for a great relief rally. Last week was another hard week for stocks, and the negative candles on the indices proved it. FANG stock remains weak as can be seen on the FNGU chart, price below the T-Line and the T-Line below the 34-EMA.
BECN RBB Setup
BECN is an (RBB) Rounded Bottom Breakout Setup, not that price has closed above the 50-SMA, and there is at least 10% between the 50-SMA and 200-SMA. The Bullish Engulf a few days ago was a bottom test followed by bullish follow through. With a swing target near the $42.50 area, BECN is a trade candidate to add to our LTA-Live Trading Alerts Real Time Market Scanner watchlist for a buying alert. BECN bullish above $31.75, stop below $29.90
****VXX – At the close Friday the VXX chart was on the bullish side suggesting fear, below $36.00 would suggest fear is under control while over $36.00 would suggest fear is once again fueled.
Trading Services We Offer
- Hit and Run Candlesticks
- Right Way Options
- Top Gun Day Trading
- 30-Day Trial
321% This Year
Rick uses three main trading tools and has dialed them in for max performance. Rick also freely shares his insights on what makes the tools the best and how to use them. Rick is also one of the only traders in the industry that shares his trading account. Traspaerancey and Trading Results.
- LTA – Live Trading Alerts Get your 30-Day Trail
- TC2000 Charting Get $25.00 Off
- TradeHawk Trading Platform
Free YouTube Education • Subscription Plans • Private 2-Hour Coaching
YouTube Videos
Trading at the Beach • How to set up the T-Line Regression Lines • MetaStock Automated • Trading the T-Line Trap • Shorting the Blue Ice Pattern
DISCLAIMER: Investing / Trading involves significant financial risk and is not suitable for everyone. No communication from us should be considered as financial or trading advice. All information provided by Hit and Run Candlesticks Inc, its affiliates or representatives is intended for educational purposes only. You are advised to test any new approach before implementing it. Past performance does not guarantee future results. Terms of Service
Black Friday
 If the news reports are correct, holiday shopping in-store and online as consumers displayed their economic confidence and ravenous desire to grab a Black Friday bargain. Unfortunately, that has not translated into bullish price action the US Futures. Instead, the market is reacting bearishly this morning with news reports suggesting the US/China trade war could extend well past the end of this year.
Currently, the Dow is pointing to a gap down of nearly 150 points testing Tuesdays low after the morning rush don’t be surprised to see very light and choppy price action as traders extend their holiday vacations and join the Black Friday shopping masses. My plan for the day is to monitor current positions only and avoid adding risk into the weekend.
On the Calendar
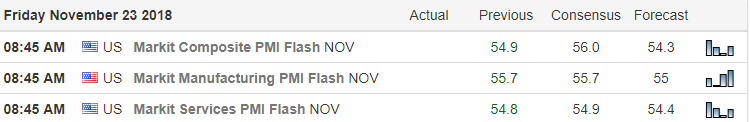
We have only 9-companies reporting earnings on this partial day of trading. That number will jump up between the 40’s the and 50’s next week as some of the last 4th quarter reports continue to trickle in.
Action Plan
New concerns that the China trade war could extend through the 2020 presidential election has the US Futures turning south this morning. According to news reports Thanksgiving in-store and online sales may have hit new record highs yesterday as confident consumers shopped a good deal of the holiday. Best Buy has reported Thursday transactions numbers were higher than ever. With the Black Friday shoppers already filling the stores this morning it looks like Santa is doing his part at least in the retail space.
My plan today is to monitor current positions and avoid the temptation of adding new risk ahead the weekend. Volume will likely be extremely light and price action choppy which makes the risk greater than the potential reward in my opinion. As a result, I intend to extend my holiday as will most other traders. If you do decide to trade today, I would suggest keeping in it small and remember that Cyber Monday often is a very last luster day as well so plan your risk accordingly.
Trade Wisely,
Doug
[button_2 color=”green” align=”center” href=”https://youtu.be/B48HmICy1Pg”]Morning Market Prep Video[/button_2]
This is my old school planner. Feel free to use it and modify it but please understand I will not be providing support for the product. If you make modifications please share it with the group.
Trade Planner,Trade Log